


Weekly Recap for Week Ended May 2, 2025
Weekly Recap of Major Micro / Macro Data Points and Things to Look Forward to in the Week Ahead

Significant News / Developments from Week Ended May 2, 2025
Online Broker Metrics – 1Q25 in Review
Now that we’ve had all the online brokers report earnings following HOOD’s release on Wednesday evening, I wanted to take some time to explore some of the key trends for the industry during 1Q25.
Total Client Assets at Quarter End:
HOOD 0.00%↑ – Total Platform Assets $220.6B
IBKR 0.00%↑ – Total Client Equity $573.5B
SCHW 0.00%↑ – Total Client Assets $9,929.7B
HOOD – Year over Year growth 38.6%
IBKR – Year over Year growth 23.1%
SCHW - Year over Year growth 8.9%
Year over Year growth across the board decelerated meaningfully in 1Q25 as client assets were impacted by market losses across each of the online brokers. During 2024, client assets and thus Year over Year growth rates were materially boosted by market gains. SCHW was the only online broker to show a sequential decline in total client assets as of the end of 1Q as its pace of asset gathering was not enough to offset the steep market losses (across the board) seen in the quarter.

Source: company documents
Below I show the same chart, however, instead of putting SCHW on a different axis than IBKR and HOOD I have all on the left axis, just to show the sheer magnitude of SCHW’s total asset base…

Source: company documents
Net New Assets:
HOOD – Total Net Deposits in 1Q25 of a record $18.0B
IBKR – Total estimated Net New Assets in 1Q25 of $22.8B*
SCHW – Total Core NNA in 1Q25 of $137.7B
HOOD – NNA Annualized Growth Rate – 30.8%**
IBKR – Estimated NNA Annualized Growth Rate – 16.0%*
SCHW – Core NNA Annualized Growth Rate – 5.5%
HOOD continues to gather assets at an astounding rate; it has fairly consistently far exceeded the asset gathering pace of IBKR and is miles above the asset gathering pace of SCHW. That being said, SCHW’s core NNA in 1Q25 of $138B was 62% of HOOD’s entire quarter-end total client assets of $220.6B, meaning SCHW clients brought in over 60% of an entire Robinhood to the firm during 1Q.
It was great to see SCHW core NNA annualized growth breach 5% during 1Q. SCHW’s historical range for NNA growth is 5-7% though it has been weighed down over the past 7 quarters as the company has been migrating legacy TD Ameritrade clients to the SCHW platform, which has caused the TD Ameritrade client NNA to fall below SCHW’s historical level. SCHW noted on its 1Q earnings call that Ameritrade clients have inflected more positively and are roughly half way to SCHW’s historical range.

Source: company documents
* IBKR estimated NNA assumes market gains/losses in a given month reflect 65% of the M/M change in the S&P 500 and that any delta between those gains/losses and M/M asset growth/decline is due to NNA (which is probably not a perfect estimate – as can be seen by a couple quarters of negative NNA growth)
**HOOD 1Q25 NNA growth rate adds $41B to the 4Q25 ending client asset denominator to reflect the TradePMR acquisition which closed at the end of February. This is likely a bit too onerous as HOOD only had 1 month to generate NNA from both entities but even on an as reported basis NNA annualized growth would have declined sequentially to 37.3%
Total Client Accounts
HOOD – Total Funded Customers of 25.8M
IBKR – Total Accounts of 3.6M
SCHW – Total Client Accounts (incl. banking and retirement plan) 44.6M
HOOD – Funded Customers Y/Y Growth – 7.7%
IBKR – Total Accounts Y/Y Growth – 31.7%
SCHW – Total Client Accounts Y/Y Growth – 4.9%
IBKR continues to bring in new accounts at breakneck pace, far above the account growth seen at HOOD or SCHW. HOOD client account growth really began to break out the past couple quarters with two sequential quarters of client account growth over 7%. For the most part, SCHW client accounts are growing roughly inline with its pace of NNA annualized growth.

Source: company documents

Source: company documents
Two notable trends begin to take shape when comparing account growth metrics with annualized NNA growth metrics. First, given HOOD’s NNA growth is far outpacing its Y/Y growth in client accounts, this suggest to me that HOOD is beginning to target larger accounts and move up market as it targets becoming a more robust financial ecosystem. Second, given IBKR’s account growth has, for the most part, far outpaced its estimated NNA growth rate, this suggests to me that IBKR may be moving down market and attempting to bring in accounts with lower overall asset levels (essentially trying to take some of what HOOD has been successful at picking up). This trend can more clearly be seen below…
Average Assets Per Account
HOOD – $8,550
IBKR – $158,609
SCHW – $222,859
HOOD – Y/Y Growth – 57.7%
IBKR – Y/Y Growth – (6.5%)
SCHW – Y/Y Growth – 4.2%
IBKR’s average assets per client account have begun to flatten out (which should not be the case as markets have risen, adding to average account value). Meanwhile, HOOD’s average account value has risen dramatically over the past 8 quarters. Notably, in its 1Q earnings call, HOOD mentioned that recent promotional activity had helped bring in new accounts with values of >$90k (and some >$180k).

Source: company documents
Similar to the beginning of this note, below I show the same chart, however, instead of putting HOOD on a different axis than IBKR and SCHW I have all on the left axis, just to show the stark difference in average account balances…

Source: company documents
Below is the Y/Y growth in average assets per account, showing HOOD clearly breaking out of late…

Source: company documents
Below is a complete table of all of the metrics discussed above. I apologize for how much space this takes up:

Source: company documents
Company Specific Updates for Week Ended May 2, 2025
Exchanges
Cboe Global Markets, Inc. (CBOE)
Reports 1Q25 EPS of $1.72 vs. consensus of $1.70
Revenue was just above street estimates
Pre-tax income beat by 1%
A full recap of ICE results is available here
CBOE Appoints Craig Donohue as New CEO
Mr. Donohue will begin his role as CEO and a member of the Board of Directors on May 7
Mr. Donohue succeeds Fred Tomczyk who has been serving as CEO during CBOE’s during the company’s search for a long-term successor following the departure of the company’s prior CEO
This announcement concludes a year and a half search process for the right candidate
About Mr. Donohue
Seasoned industry executive with over 30 years of experience
Experience includes two decades at CME where he spent 8 years as CEO
Served as Chairman of the Board at OCC where he also spent 3 years as CEO
This is a very strong hire for CBOE and I’m excited to see what the next chapter holds for the org
CME Group Inc. (CME)
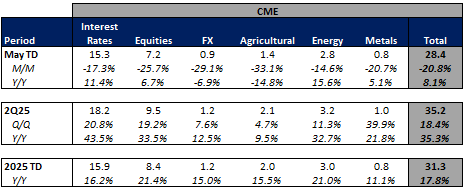
Reports Record April ADV of 35.9M contracts
Record equity index ADV of 9.7M
Record metals ADV of 1.0M
Full exchange volume note with EPS impacts available here
Intercontinental Exchange, Inc. (ICE)
United Wholesale Mortgage Selects ICE Mortgage Technology to Power In-House Servicing Strategy
Reports 1Q25 EPS of $1.72 vs. consensus of $1.70
Revenue was just above street estimates
Pre-tax income beat by 1%
A full recap of ICE results is available here
Announces 2Q dividend of $0.48 (unchanged dividend amount after increase in 1Q25)
Nasdaq, Inc. (NDAQ)
Fixed Income Trading Platforms
Tradeweb Markets Inc. (TW)
Reports 1Q25 EPS of $0.86 vs. consensus of $0.86
Revenue was just above street estimates
Pre-tax income beat by 2%
A full recap of TW results is available here
Online Brokers
Robinhood Markets, Inc. (HOOD)
Reports 1Q25 EPS of $0.37 vs. consensus of $0.33
Revenue was 1% above street estimates
A full recap of HOOD results is available here
Interactive Brokers Group, Inc. (IBKR)
Reports monthly metrics for April
Total Accounts increased 3% M/M (+32% Y/Y) to 3,711k
Client DARTs increased 10% M/M (+63% Y/Y) to a record 3,818k
Client equity was up 3% M/M (+29% Y/Y) to $588B
Client Credits increased 6% M/M (+26% Y/Y) to $133B
Margin Balances declined 9% M/M (+15% Y/Y) to $58B – recall on the 1Q25 earnings call that IBKR had mentioned margin balances were down 12% in mid-April
IBKR continues to put up really good customer growth numbers and it was great to see margin balances come off the lows mentioned on the 1Q earnings call
The Charles Schwab Corporation (SCHW)
Thousands of Charles Schwab Employees Volunteer to Serve Nearly 350 Nonprofits Nationwide
Unveils National Investing Day to Educate and Empower Individual Investors
Will take place on May 1 each year to raise awareness about the power of long-term investing
Note: Within the company guidance tracker section of this post, CBOE, HOOD, ICE and TW guidance tables have been updated to reflect commentary from this week’s earnings calls.
Company Specific Updates Anticipated for the Upcoming Week (Ended May 9, 2025)
Exchanges
Cboe Global Markets, Inc. (CBOE)
Apr. Volume Release – Monday, May 5, post-close
Intercontinental Exchange, Inc. (ICE)
Apr. Volume Release – Monday, May 5, pre-market
Nasdaq, Inc. (NDAQ)
Apr. Volume Release – Monday, May 5, post-close
Fixed Income Trading Platforms
MarketAxess Holdings Inc. (MKTX)
Apr. Volume Release – Tuesday, May 6, pre-market
1Q25 Earnings Release – Wednesday, May 7, pre-market
Tradeweb Markets Inc. (TW)
Apr. Volume Release – Tuesday, May 6, pre-market
Online Brokers
None to Note
Next Four Weeks Calendar

Source: Company press releases and my estimates around timing
Major Macro Updates for Week Ended May 2, 2025
Advanced U.S. Trade Balance in Goods (Mar.) – $162.0B vs. prior $147.8B
Advanced Retail Inventories (Mar.) – (0.1%) vs. prior (0.1%)
Advanced Wholesale Inventories (Mar.) – 0.5% vs. prior 0.5%
S&P Case-Shiller Home Price Index (Feb.) – 4.5% vs. consensus 4.8% and prior 4.7%
Consumer Confidence (Apr.) – 86.0 vs. consensus 87.7 and prior 92.9
Job Openings (Mar.) – 7.2M vs. consensus 7.5M and prior 7.6M
ADP Employment (Apr.) – 62k vs. consensus 120k and prior 147k
GDP (1Q) – (0.3%) vs. consensus 0.4% and prior 2.4%
Personal Income (Mar.) – 0.5% vs. consensus 0.4% and prior 0.7%
Consumer Spending (Mar.) – 0.7% vs. consensus 0.5% and prior 0.4%
PCE Index (Mar.) – 0.0% vs. consensus 0.0% and prior 0.3%
PCE Y/Y (Mar.) – 2.3% vs. consensus 2.2% and prior 2.7%
Core PCE Index (Mar.) – 0.0% vs. consensus 0.1% and prior 0.4%
Core PCE Y/Y (Mar.) – 2.6% vs. consensus 2.6% and prior 3.0%
Employment Cost Index (1Q) – 0.9% vs. consensus 0.9% and prior 0.9%
Chicago Business Barometer (Apr.) – 44.6 vs. consensus 45.5 and prior 47.6
Pending Home Sales (Mar.) – 6.1% vs. consensus 1.0% and prior 2.1%
Initial jobless claims (week ended Apr. 26) – 241k vs. consensus 225k and prior 2232k
ISM Manufacturing (Apr.) – 48.7 vs. consensus 47.8 and prior 49.0
Construction Spending (Mar.) – (0.5%) vs. consensus 0.2% and prior 0.6%
S&P Final U.S. Manufacturing PMI (Apr.) – 50.2 vs. consensus 50.6 and prior 50.7
Auto Sales (Apr.) – 17.3M vs. prior 17.8M
Nonfarm Payrolls (Apr.) – 177k vs. consensus 133k and prior 185k
U.S. Unemployment Rate (Apr.) – 4.2% vs. consensus 4.2% and prior 4.2%
U.S. Hourly Wages (Apr.) – 0.2% vs. consensus 0.3% and prior 0.3%
Hourly Wages Y/Y (Apr.) – 3.8% vs. consensus 3.9% and prior 3.8%
Factory Orders (Mar.) – 4.3% vs. consensus 4.3% and prior 0.5%
Major Macro Updates Scheduled for the Upcoming Week (Ended May 9, 2025)
Monday, May 5
S&P Final U.S. Services PMI (Apr.) – consensus 51.0 and prior 51.4
ISM Services (Apr.) – consensus 50.4% and prior 50.8%
Tuesday, May 6
U.S. Trade Deficit (Mar.) – consensus 136.0B and prior $122.7B
Wednesday, May 7
FOMC Meeting Ends 2:00pm ET
Powell Press Conference 2:30pm ET
Consumer Credit (Mar.) – consensus $11.0B prior ($800)M
Thursday, May 8
Initial jobless claims (week ended May 3) – consensus 230k and prior 241k
U.S. Productivity (1Q) – consensus (0.5%) and prior 1.5%
Wholesale Inventories (Mar.) – consensus 0.5% and prior 0.3%
Friday, May 9
None to Note
Exchange Volume Update
Exchange Volumes Over Past Week and W/W Trends
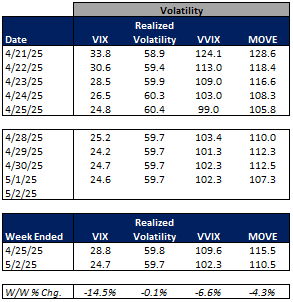
For the week ended May 2, 2025, volatility generally cooled though volumes were mixed W/W and remained elevated relative to historicals.
The average VIX for the week was down 15% from the prior week, average realized volatility remained unchanged W/W, average volatility of volatility (as measured by the VVIX) was down 7% W/W and the average MOVE index (U.S. Treasuries volatility) was down 4% W/W.
Futures average daily volumes (ADV) were mixed as CBOE futures volumes were down 9% W/W, CME futures volumes were up 5% W/W, and ICE futures volumes were down 4% W/W.
Total U.S. Equities ADV was up 15%W/W, mainly driven by off-exchange trading as TRF volumes were up 20% W/W. Industry equity options volumes were down 11% W/W while index options volumes declined 4% W/W.
For further detail on weekly volume trends by exchange and by product line please see the charts below.
CME Futures Volumes (M)

Source: Company Daily Volume Releases
ICE Futures (M), U.S. Equities (B) and U.S. Equity Options (M) Volumes

Source: Company Daily Volume Releases, Cboe Global Markets and OCC
CBOE Options (M), Futures (K), U.S. Equity (B), and FX Volumes ($B)

Source: Company Daily Volume Releases and OCC
NDAQ U.S. Equity (B) and Option (M) Volumes

Source: Cboe Global Markets and OCC
U.S. Total Industry Equity Volumes (B)

Source: Cboe Global Markets
U.S. Total Industry Equity Option and Index Option Volumes (M)

Source: OCC
Volatility Metrics
Source: Yahoo Finance
Exchange Volumes MTD / QTD / YTD Trends
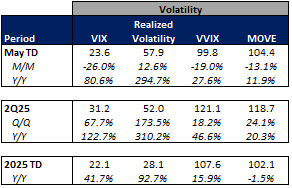
Exchange volumes are tracking lower in May-to-date relative to April but are generally higher Y/Y. This comes as volatility is up MTD on a Y/Y basis.
The average VIX in May-to-date is up 81% Y/Y while realized volatility is up 295% Y/Y and volatility of volatility is up 28% Y/Y. Treasuries volatility is higher as well Y/Y as the average MOVE index in May-to-date is up 12% Y/Y.
Futures volumes are generally higher Y/Y as ICE futures MTD ADV is up 36% vs. May 2024 ADV. Meanwhile, CME ADV is up 8% Y/Y while CBOE futures ADV is down 9% Y/Y.
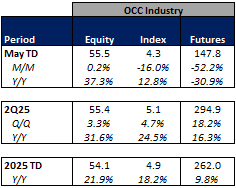
In terms of equities and options volumes, total U.S. equities ADV is up 32% MTD while option volumes are up 42% for equity options and up 22% for index options
For further details on MTD / QTD and YTD ADV please see the charts below.
CME Futures Volumes (M)
Source: Company Daily Volume Releases
ICE Futures (M), U.S. Equities (B) and U.S. Equity Options (M) Volumes

Source: Company Daily Volume Releases, Cboe Global Markets and OCC
CBOE Options (M), Futures (K), U.S. Equity (B), and FX Volumes ($B)

Source: Company Daily Volume Releases and OCC
NDAQ U.S. Equity (B) and Option (M) Volumes

Source: Cboe Global Markets and OCC
U.S. Total Industry Equity Volumes (B)

Source: Cboe Global Markets
U.S. Total Industry Equity Option and Index Option Volumes (M)
Source: OCC
Volatility Metrics
Source: Yahoo Finance
Major Indices, Interest Rates and Company Share Price Trends
Once again, we had a bit calmer week over the past 5 sessions with the VIX down 9% on the week, though earnings season was in full swing. Ultimately, the market closed the week out up 290bps after rising 150bps Friday following a positive jobs report for April.
In terms of the companies I follow, the exchanges showed the best performance up 4%-6% W/W as CBOE and ICE reported solid earnings reports. Fixed income trading land was mixed as well with MKTX rising 3% and TW up 5%, following its earnings release on Wednesday. The online brokers were mixed with SCHW up 4% and IBKR up 7%, both on limited micro news, while HOOD declined 2% following its earnings release on Wednesday evening (which I thought was generally an OK print).
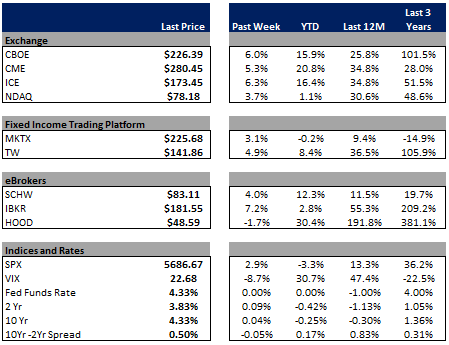
Source: Yahoo Finance, FRED, U.S. Department of the Treasury
Comp Sheet

Source: PitchBook
Guidance Tracker
Exchanges
Cboe Global Markets, Inc. (CBOE)
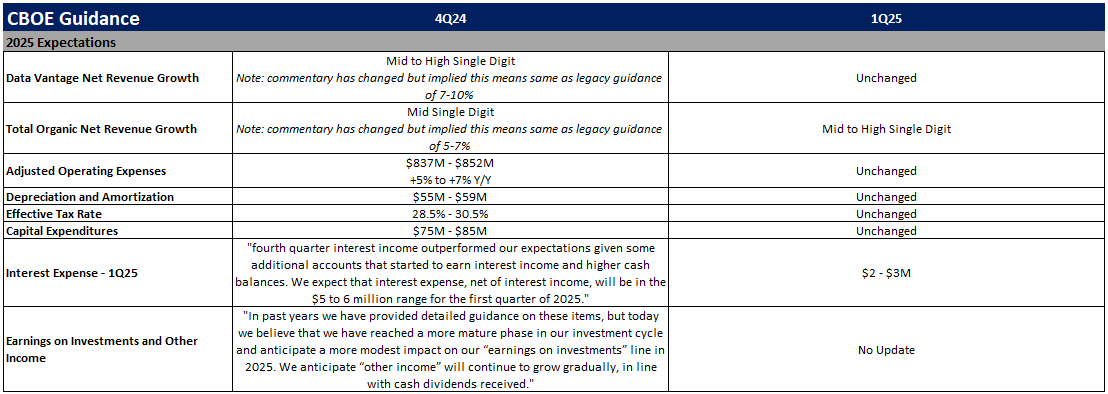
Source: Company documents
Note: CBOE provided additional guidance points / commentary on its 1Q25 earnings call, but key annual highlights are included above for the sake of simplicity
CME Group Inc. (CME)

Source: Company documents
Note: CME provided additional guidance points / commentary on its 1Q25 earnings call, but key annual highlights are included above for the sake of simplicity
Intercontinental Exchange, Inc. (ICE)

Source: Company documents
Note: ICE provided additional guidance points / commentary on its 1Q25 earnings call, but key annual highlights are included above for the sake of simplicity
Nasdaq, Inc. (NDAQ)

Source: Company documents
Note: NDAQ provided additional guidance points / commentary on its 1Q25 earnings call, but key annual highlights are included above for the sake of simplicity
Fixed Income Trading Platforms
MarketAxess Holdings Inc. (MKTX)

Source: Company documents
Note: MKTX provided additional guidance points / commentary on its 4Q24 earnings call, but key annual highlights are included above for the sake of simplicity
Tradeweb Markets Inc. (TW)

Source: Company documents
Note: TW provided additional guidance points / commentary on its 1Q25 earnings call, but key annual highlights are included above for the sake of simplicity
Online Brokers
Robinhood Markets, Inc. (HOOD)

Source: Company documents
Note: HOOD provided additional guidance points / commentary on its 1Q25 earnings call, but key annual highlights are included above for the sake of simplicity
Interactive Brokers Group, Inc. (IBKR)
Source: Company documents
Note: IBKR provided additional guidance points / commentary on its 1Q25 earnings call, but key annual highlights are included above for the sake of simplicity
The Charles Schwab Corporation (SCHW)
