April Exchange Volumes – Volatility and Volumes Substantially Higher; Numerous Records Set
Monthly Recap of Exchange Volumes for April and EPS Impacts for the Exchanges

In April, average volume and volatility metrics increased dramatically and set several monthly records as tariff driven volatility drove markets in the month. Quarter-to-date exchange volumes are tracking mainly higher both Q/Q and Y/Y, which should lead to increased transaction-based revenues across the exchange landscape for 2Q if the current volume levels persist. Based on current QTD volume trends, I currently see 6% to 20% upside to exchange EPS estimates for 2Q (assuming current ADV levels hold through quarter-end – which I do not anticipate they will, this is just an illustrative calc) with CME showing the strongest volume results (implying 20% EPS upside for the quarter) and NDAQ showing the least amount of upside at 6% (which makes sense given NDAQ’s de-emphasis on transaction based revenue streams).

Source: company documents and my estimates
Industry Wide Volume Recap
Volatility
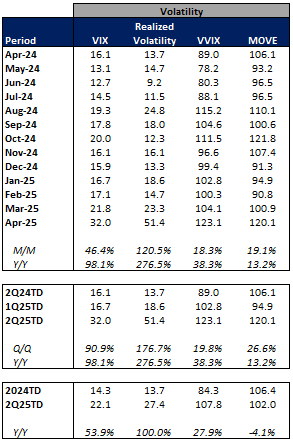
Average volatility was materially higher in April relative to March’s averages as the VIX was up 46% M/M, realized volatility (measured by the daily changes in the S&P 500) was up 121% M/M, volatility of volatility (as measured by the VVIX) was up 18% M/M and treasury volatility (as measured by the MOVE index) was up 19% M/M. Relative to a year ago, average volatility was elevated as well in April with the VIX up 98% Y/Y, realized volatility up 277% Y/Y, the VVIX up 38% Y/Y and the MOVE index up 13% Y/Y.
On a quarter-to-date basis, volatility is significantly higher relative to both 1Q25-to-date and the year ago quarter-to-date. The average QTD VIX of 32.0 is up 91% Q/Q (+98% Y/Y), while realized volatility is averaging 51.4 (+177% Q/Q, +277% Y/Y), the VVIX is averaging 123.1 (+20% Q/Q, +38% Y/Y) and the MOVE index is averaging 120.1 (+27% Q/Q, +13% Y/Y).
Please note that throughout the entirety of this piece QTD averages are being calculated as through the first one month of the quarter for the current quarter to date, the prior quarter to date and the year ago quarter to date.
Average volatility levels can generally be indicative of trading activity with volumes generally increasing in periods of heightened volatility and decreasing as volatility subsides.
13 Month Trailing Volatility Metrics
Source: Yahoo Finance
U.S. Equities
Average U.S. cash equities volumes (ADV) hit a record level in April at 19.3 billion shares traded per day (+76% Y/Y). The Y/Y increase was primarily driven by off-exchange volumes (Trade Reporting Facility or TRF Volume) as TRF volumes were up 92% Y/Y (+19% M/M) to 9.3 billion traded per day while on-exchange volumes were up 64% Y/Y (+22% M/M) to 10.0 billion traded per day. This marks the second month in a row where on-exchange activity exceeded that of TRF trading volumes amidst the heightened volatility environment.
On a quarter-to-date basis, U.S. equity ADV is higher both sequentially and year over year (+25% Q/Q, +76% Y/Y). On a Y/Y basis, QTD growth is being driven by off-exchange volumes with QTD TRF ADV of 9.3 billion (+17% Q/Q, +92% Y/Y) while on-exchange volumes are averaging 10.0 billion shares per day (+33% Q/Q, +64% Y/Y).
13 Month Trailing Average Daily U.S. Cash Equities Volumes

Source: Cboe Global Markets
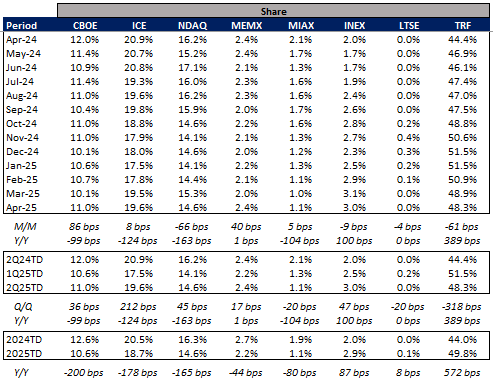
In terms of market share of U.S. cash equities volumes, the big three publicly traded U.S. exchange groups (CBOE, ICE, NDAQ) showed mixed market share in April relative to March levels but all three showed substantial Y/Y declines in market share in the month. CBOE posted market share of 11.0% in April (+86 bps M/M, -99 bps Y/Y), ICE posted market share of 19.6% in April (+8 bps M/M, -124 bps Y/Y) and NDAQ posted market share of 14.6% (-66 bps M/M, -163 bps Y/Y).
For the quarter-to-date, CBOE market share is averaging 11.0%, (+36 bps Q/Q, -99 bps Y/Y), ICE is averaging 19.6% (+212 bps Q/Q, -124 bps Y/Y) and NDAQ is averaging 14.6% (+45 bps Q/Q, -163 bps Y/Y).
13 Month Trailing U.S. Cash Equities Market Share
Source: Cboe Global Markets
13 Month Trailing U.S. Cash Equities Market Share

Source: Cboe Global Markets
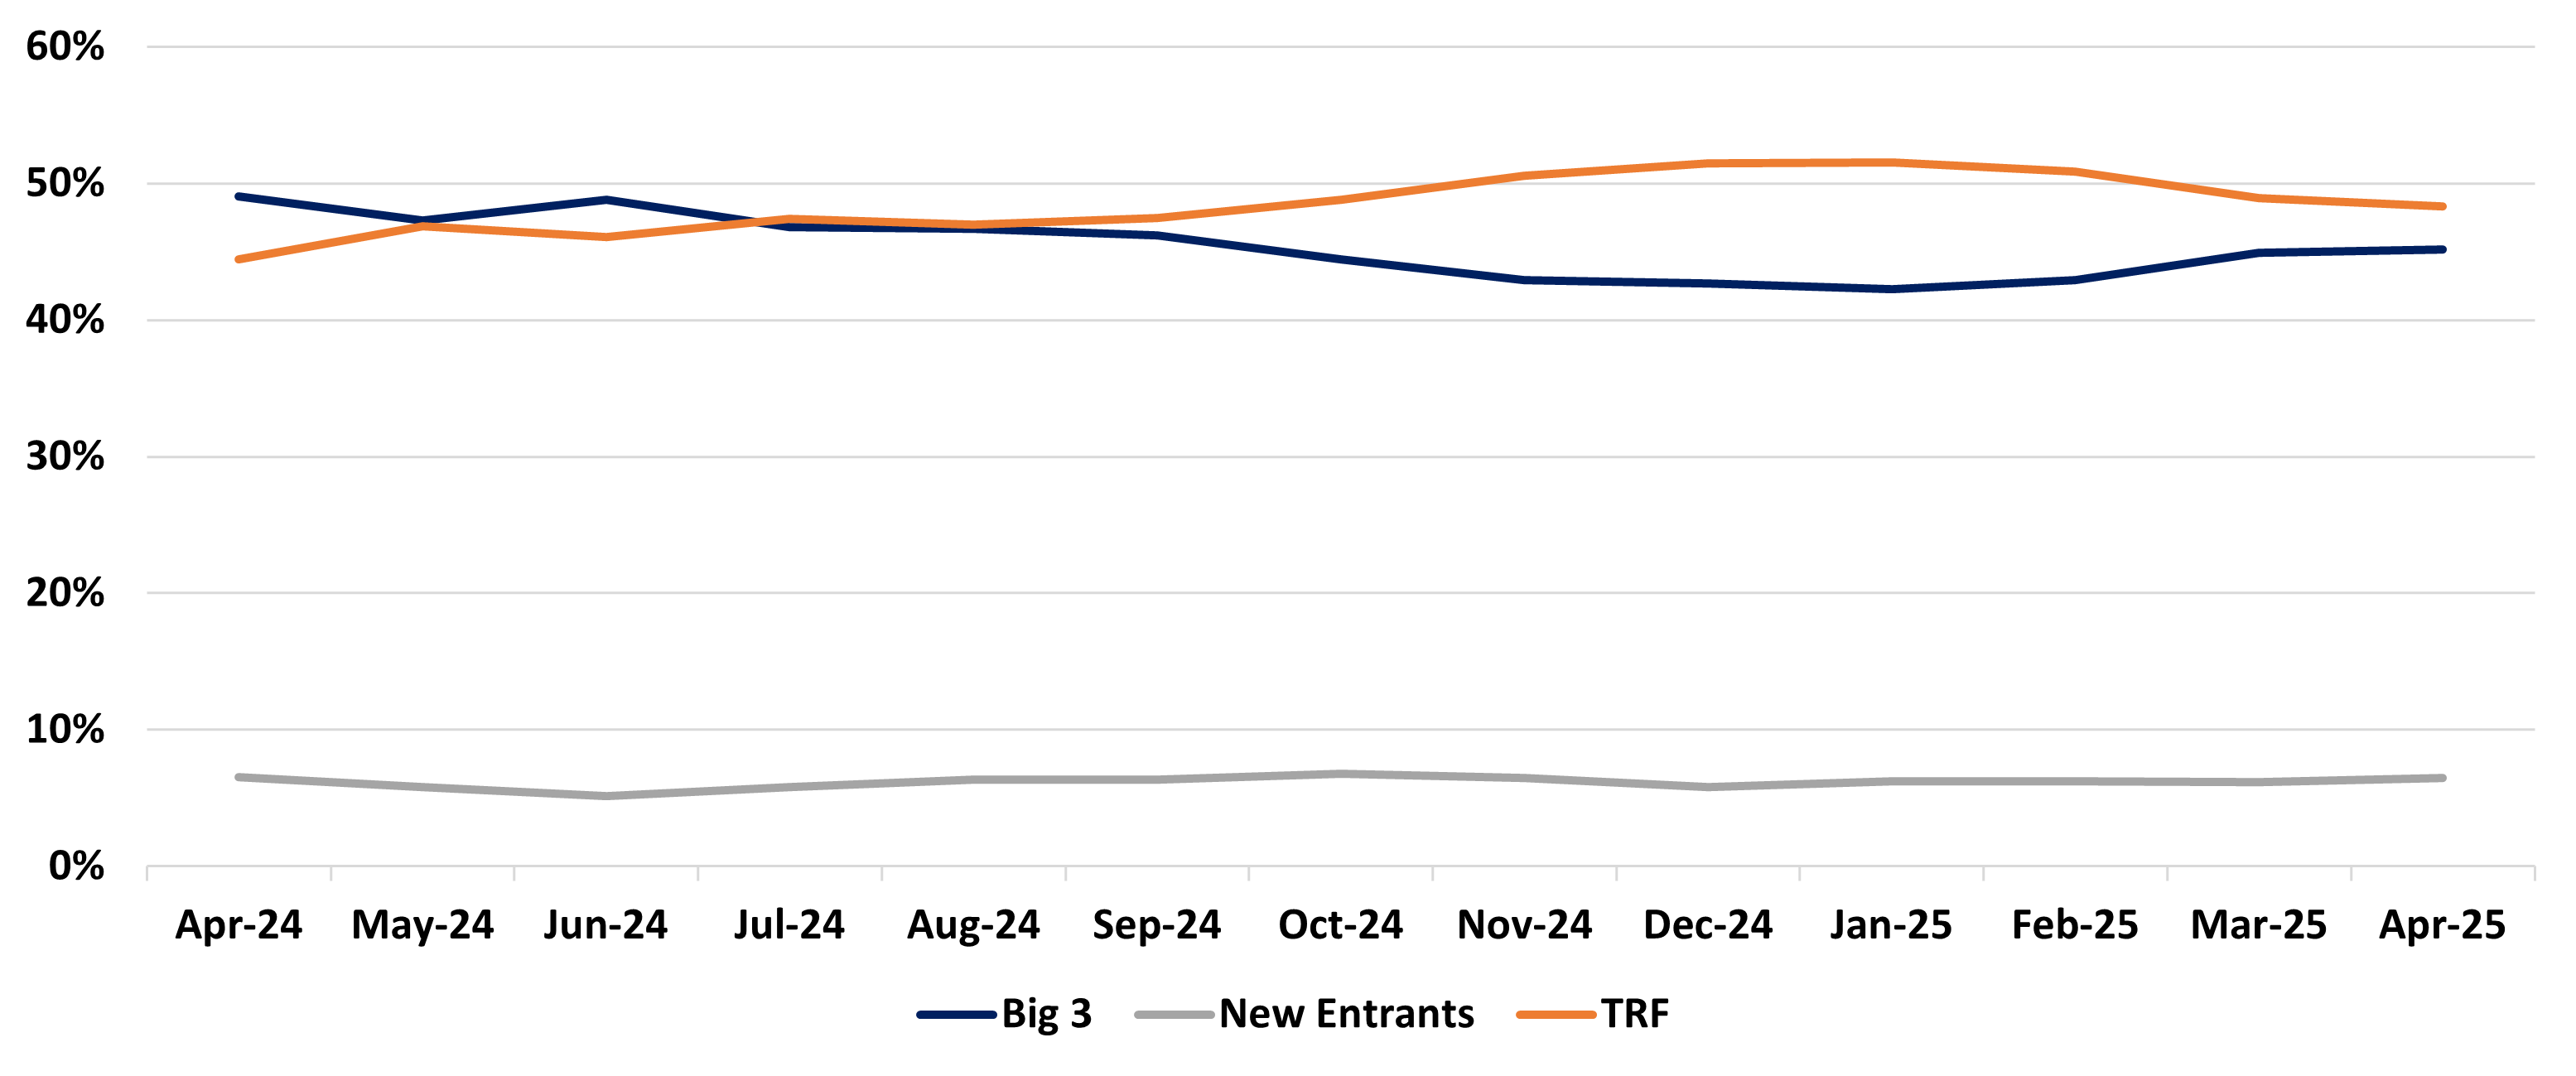
As we can see in the graph below, off-exchange volumes surpassed that of the combined market share of the big 3 publicly traded exchanges in July of 2024 and have continued to remain elevated since.
13 Month Trailing U.S. Cash Equities Market Share
Source: Cboe Global Markets
U.S. Options, Index Options and OCC Futures Volumes
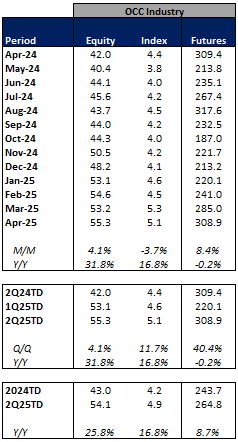
Average U.S. equity options volumes were up 4% M/M in April to a record 55.3 million contracts traded per day and increased 32% Y/Y. Meanwhile Index option volumes were down 4% M/M in April to 5.1 million contracts per day (+17% Y/Y) and OCC Futures volumes increased 8% M/M in April to 309k contracts per day (flat Y/Y).
On a quarter-to-date basis, U.S. equity options ADV is higher both sequentially and year over year as volumes are averaging 55.3 million contracts traded per day (+4% Q/Q, +32% Y/Y). Index options volumes are averaging 5.1 million contracts per day (+12% Q/Q, +17% Y/Y) while OCC Futures volumes are averaging 309k per day (+40% Q/Q, flat Y/Y).
13 Month Trailing Average Daily U.S. Equity Options, Index and OCC Futures Volumes
Source: OCC
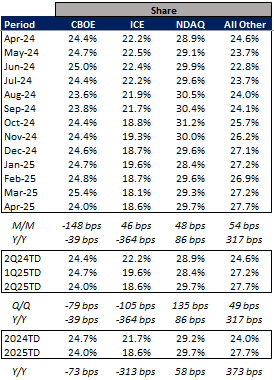
In terms of market share of U.S. equity options volumes, the big three publicly traded U.S. exchange groups (CBOE, ICE, NDAQ) showed mixed results in April relative to March and year ago levels. CBOE posted market share of 24.0% in April (-148 bps M/M, -39 bps Y/Y), ICE posted market share of 18.6% in April (+46 bps M/M, -364 bps Y/Y) and NDAQ posted market share of 29.7% (+48 bps M/M, +86 bps Y/Y).
For the quarter-to-date, CBOE market share is averaging 24.0%, (-79 bps Q/Q, -39 bps Y/Y), ICE is averaging 18.6% (-105 bps Q/Q, -364 bps Y/Y) and NDAQ is averaging 29.7% (+135 bps Q/Q, +86 bps Y/Y).
13 Month Trailing U.S. Equity Options Market Share
Source: OCC
13 Month Trailing U.S. Equity Options Market Share
Source: OCC
Company Specific Updates
Cboe Global Markets, Inc. (CBOE)
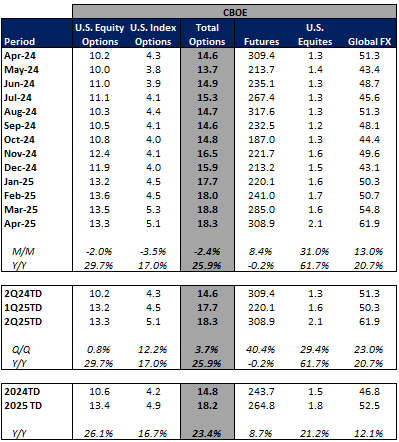
CBOE 0.00%↑ volumes ended April mixed as equity options and index options declined vs. March levels while U.S. equities, futures and FX volumes increased M/M. U.S. cash equities ADV at CBOE was 2.1 billion for the month, up 31% M/M (+62% Y/Y). Equity options volumes at CBOE averaged 13.3 million per day (-2% M/M, +30% Y/Y). Index options ADV came in at 5.1 million in April (-4% M/M, +17% Y/Y), futures volumes ended April at 309k per day (+8% M/M, unchanged Y/Y) and Global FX volumes ended the month at $61.9 billion per day (+13% M/M, +21% Y/Y).
For the quarter, volumes across the board are tracking higher both sequentially and year over year. U.S. equity options ADV is averaging 13.3 million (+1% Q/Q, +30% Y/Y), Index options ADV is tracking at 5.1 million (+12% Q/Q, +17% Y/Y), futures volumes are averaging 309k (+40% Q/Q, unchanged Y/Y), U.S. equities ADV is averaging 2.1 billion and Global FX ADNV is tracking at $61.9 billion (+23% Q/Q, +21% Y/Y).
CBOE Key Product Lines Trailing 13 Month ADV
Source: Cboe Global Markets and OCC
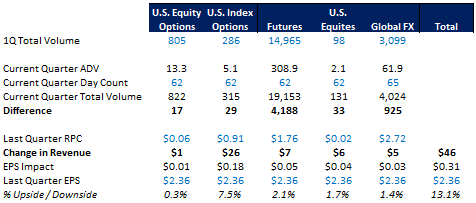
In terms of the revenue and EPS impact from the above volume statistics for CBOE, relative to last quarter’s results I see about $46 million in revenue upside to CBOE’s transaction based revenues for 2Q25. This translates into about $0.31in EPS, or 13% upside relative to what CBOE is projected to report when it reports earnings tomorrow.
Source: company documents and my estimates
CME Group Inc. (CME)
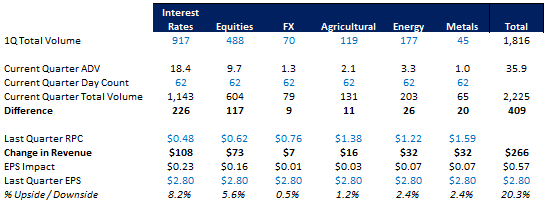
CME 0.00%↑ total volumes ended April at a record 35.9M contracts per day. Total CME ADV increased 16% M/M to 35.9 million contracts per day (+36% Y/Y). Interest rates ADV increased to 18.4 million per day (+26% M/M, +46% Y/Y), metals ADV rose to a record 1.0 million (+45% M/M, +3% Y/Y), Ags ADV increased to 2.1 million (+16% M/M, +16% Y/Y), FX ADV declined to 1.3 million (-6% M/M, +28% Y/Y), energy ADV increased to 3.3 million (+24% M/M, +37% Y/Y) and equities ADV increased to a record 9.7 million (+1% M/M, +28% Y/Y).
For the quarter-to-date total CME volumes are averaged 35.9 million per day (+40% Q/Q, +36% Y/Y). By contract type, Energy ADV has increased to 3.3 million per day (+1% Q/Q, +37% Y/Y), FX ADV has increased to 1.3 million per day (+24% Q/Q, +28% Y/Y), equities ADV has increased to 9.7 million per day (+39% Q/Q, +28% Y/Y), Ags ADV has increased to 2.1 million per day (+6% Q/Q, +16% Y/Y), metals ADV has increased to 1.0 million per day (+49% Q/Q, +3% Y/Y) and interest rates ADV has increased to 18.4 million per day (+58% Q/Q, +46% Y/Y).
CME Key Product Lines Trailing 13 Month ADV

Source: CME Group Inc.
In terms of the revenue and EPS impact from the above volume statistics for CME, relative to last quarter’s results I see about $266 million in revenue upside to CME’s transaction based revenues for 2Q25. This translates into about $0.57 in EPS, or 20% upside relative to what CME reported last quarter.
Source: company documents and my estimates
Intercontinental Exchange, Inc. (ICE)
ICE 0.00%↑ volumes were mainly higher M/M in April with new records set across energy futures and interest rate futures. Total futures ADV increased to 11.5 million (+11% M/M, +44% Y/Y) as energy ADV increased to 6.0 million (+18% M/M, +41% Y/Y), interest rate ADV increased to 4.5 million (+7% M/M, +59% Y/Y) and other financials ADV decreased to 0.4 million (-33% M/M, +41% Y/Y) while ags & metals ADV rose to 0.5 million per day (+29% M/M, -5% Y/Y). U.S. options volumes increased to 10.3 million per day (+7% M/M, +10% Y/Y) while U.S. equities volumes increased to 3.8 billion per day (+19% M/M, +63% Y/Y).
For the quarter-to-date, ICE’s volumes are generally higher both Q/Q and Y/Y with total futures ADV increasing to 11.5 million per day (+16% Q/Q, +44% Y/Y), U.S. options increasing to 10.3 million per day (-1% Q/Q, +10% Y/Y) and U.S. equities ADV increasing to 3.8 billion per day (+40% Q/Q, +66% Y/Y).
ICE Key Product Lines Trailing 13 Month ADV

Source: Intercontinental Exchange, Inc., Cboe Global Markets and OCC
In terms of the revenue and EPS impact from the above volume statistics for ICE, relative to last quarter’s results I see about $135 million in revenue upside to ICE’s transaction-based revenues for 2Q25. This translates into about $0.18 in EPS, or 10% upside relative to what ICE reported last quarter.

Source: company documents and my estimates
Nasdaq, Inc. (NDAQ)
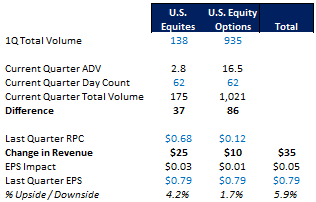
NDAQ 0.00%↑ volumes were higher both M/M and Y/Y in April. U.S. equities ADV increased to 2.8 billion (+16% M/M, +59% Y/Y) while U.S. equity options ADV increased to 16.5 million (+6% M/M, +36% Y/Y).
For the quarter-to-date, NDAQ volumes have increased sequentially and Y/Y. U.S. equities ADV is tracking at 2.8 billion (+29% Q/Q, +56% Y/Y) and U.S. options ADV has increased to 16.5 million (+9% Q/Q, +36% Y/Y).
NDAQ Key Product Lines Trailing 13 Month ADV

Source: Cboe Global Markets and OCC
In terms of the revenue and EPS impact from the above volume statistics for NDAQ, relative to last quarter’s results I see about $35 million in revenue upside to NDAQ’s transaction based revenues for 2Q25. This translates into about $0.05 in EPS, or 6% upside relative to what NDAQ reported last quarter.