


Weekly Recap for Week Ended May 16, 2025
Weekly Recap of Major Micro / Macro Data Points and Things to Look Forward to in the Week Ahead

Significant News / Developments from Week Ended May 16, 2025
This past week felt like it was dominated by the eBrokers, at least for me. Between Robinhood and Schwab reporting monthly metrics for April, Robinhood announcing a small acquisition Tuesday morning, eToro completing it’s IPO and finally floating on May 14 it was a busy week for the group. The good news is, now we have a couple more eBrokers to monitor (after Webull’s SPAC deal back in April the group is now up to five).
As a note, given the eToro IPO this past week, I thought it was the right time to pull together a brief and high level “primer” on the eBroker industry. I plan to publish this piece tomorrow morning pre-market and will be outlining how the eBrokerage industry operates, looking at some key growth metrics for the group, and briefly touching on valuation across BULL 0.00%↑, ETOR 0.00%↑, HOOD 0.00%↑, IBKR 0.00%↑, SCHW 0.00%↑.
Below I recap April monthly metrics across HOOD, IBKR and SCHW given these three have been public the longest and have gotten into a cadence of reporting metrics on a monthly basis. Eventually, I plan to separate this into its own monthly write-up (similar to my exchange monthly volume updates, example here) but for now I’m including with my weekly recap for this past week.
Online Broker Metrics – April in Review
Now that we’ve had all the online brokers report monthly metrics for April following SCHW’s release on Wednesday morning, I wanted to take some time to explore some of the key trends for the industry during the month. Note, that this week’s releases weren’t extraordinarily market moving given earnings occurred two weeks prior and much of this week’s information was known.
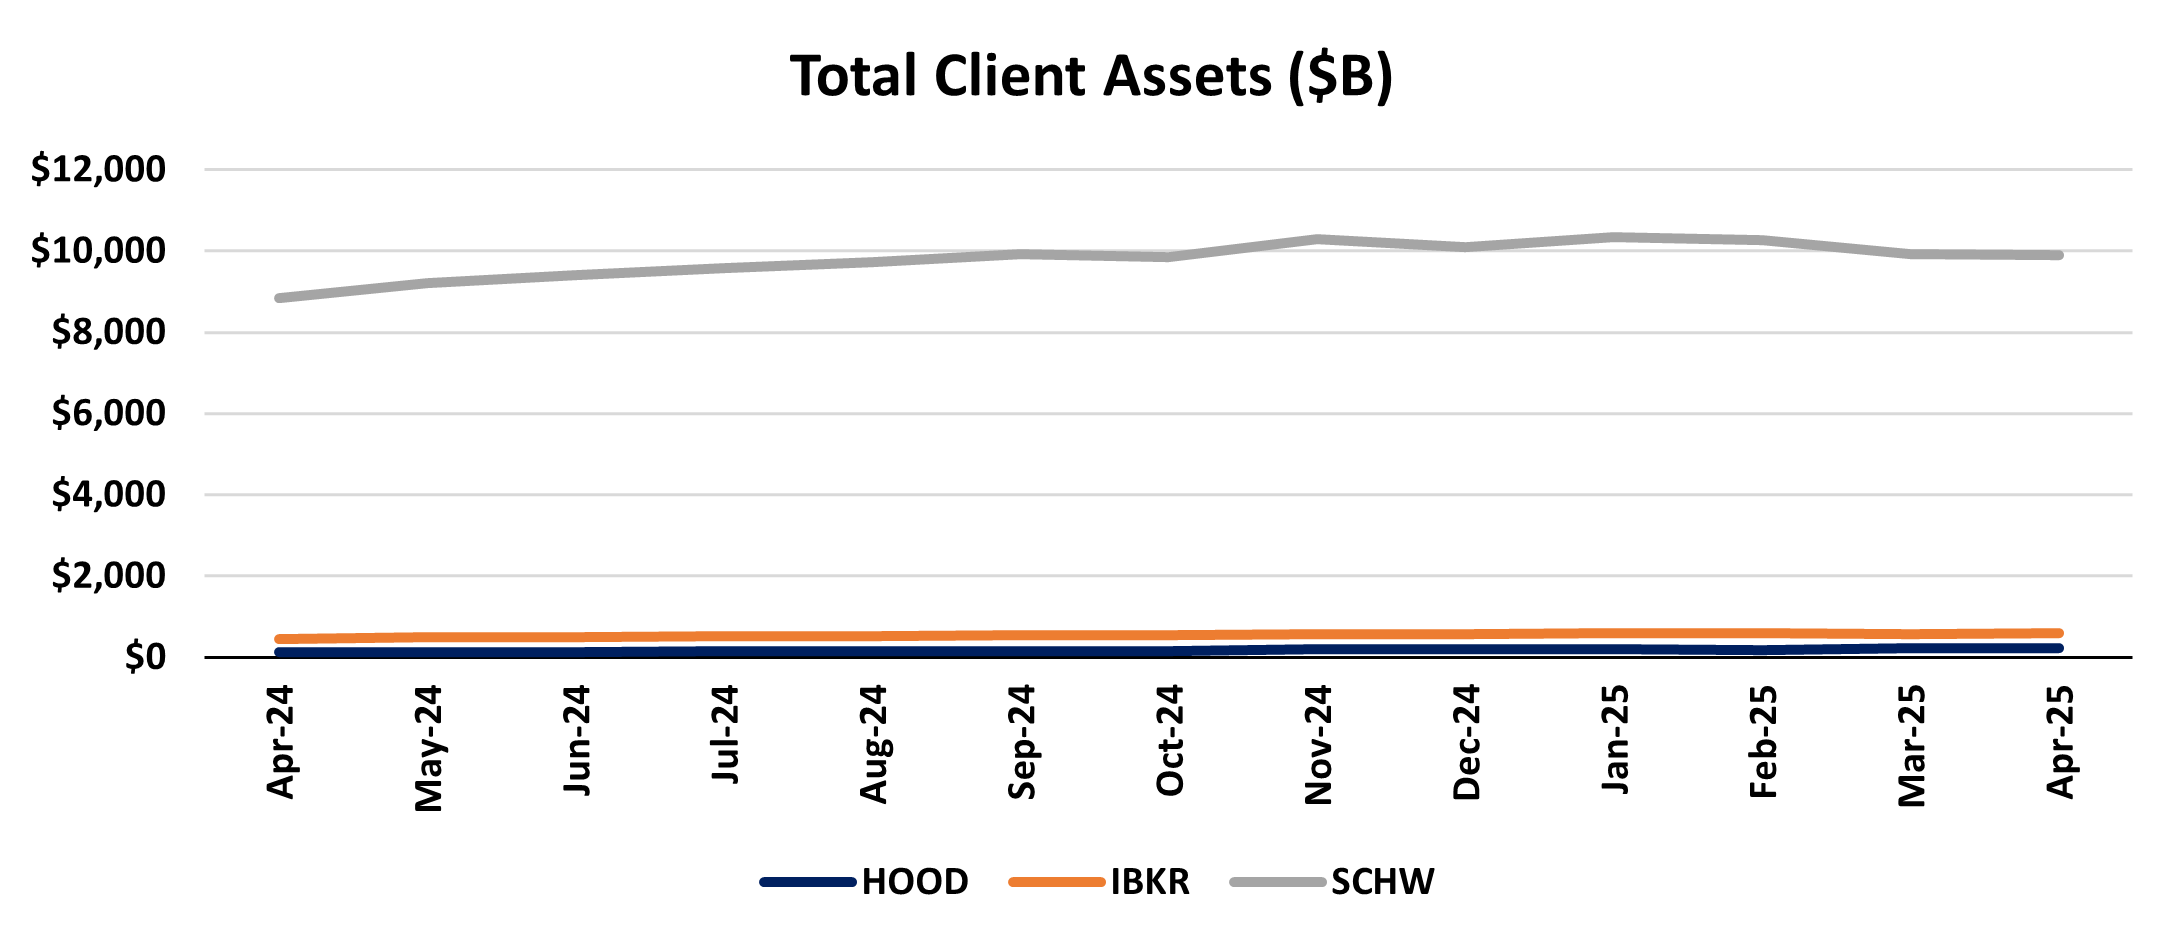
Total Client Assets at Month End:
HOOD – Total Platform Assets $232.3B
IBKR – Total Client Equity $588.1B
SCHW – Total Client Assets $9,892.0B
HOOD – Year over Year growth 88.4% (55% adj. for $41B of TradePMR acquired assets)
IBKR – Year over Year growth 28.5%
SCHW – Year over Year growth 11.8%
Year over Year growth across the board increased M/M as March 2025 results were impacted by the S&P drawdown and April of 2024 saw a large sell-off in the S&P as well. SCHW was the only online broker to show a sequential decline in total client assets as of the end of April as its pace of asset gathering (seasonally slow in April) was not enough to offset the market losses in the month.

Source: company documents
Below I show the same chart, however, instead of putting SCHW on a different axis than IBKR and HOOD I have all on the left axis, just to show the sheer magnitude of SCHW’s total asset base…
Source: company documents
Net New Assets:
HOOD – Total Net Deposits of $6.8B
IBKR – Total estimated Net New Assets of $17.4B*
SCHW – Total Core NNA of $2.7B
HOOD – NNA Annualized Growth Rate – 37.0%
IBKR – Estimated NNA Annualized Growth Rate – 36.5%*
SCHW – Core NNA Annualized Growth Rate – 0.3%
HOOD continues to gather assets at an astounding rate; it has fairly consistently exceeded the asset gathering pace of IBKR and is miles above the asset gathering pace of SCHW. That being said, SCHW’s core NNA in April is seasonally very light (sometimes negative) as tax season hits and clients typically move assets out of SCHW to pay their tax bill.

Source: company documents
* IBKR estimated NNA assumes market gains/losses in a given month reflect 65% of the M/M change in the S&P 500 and that any delta between those gains/losses and M/M asset growth/decline is due to NNA (which is probably not a perfect estimate – as can be seen by a couple months of negative NNA growth)
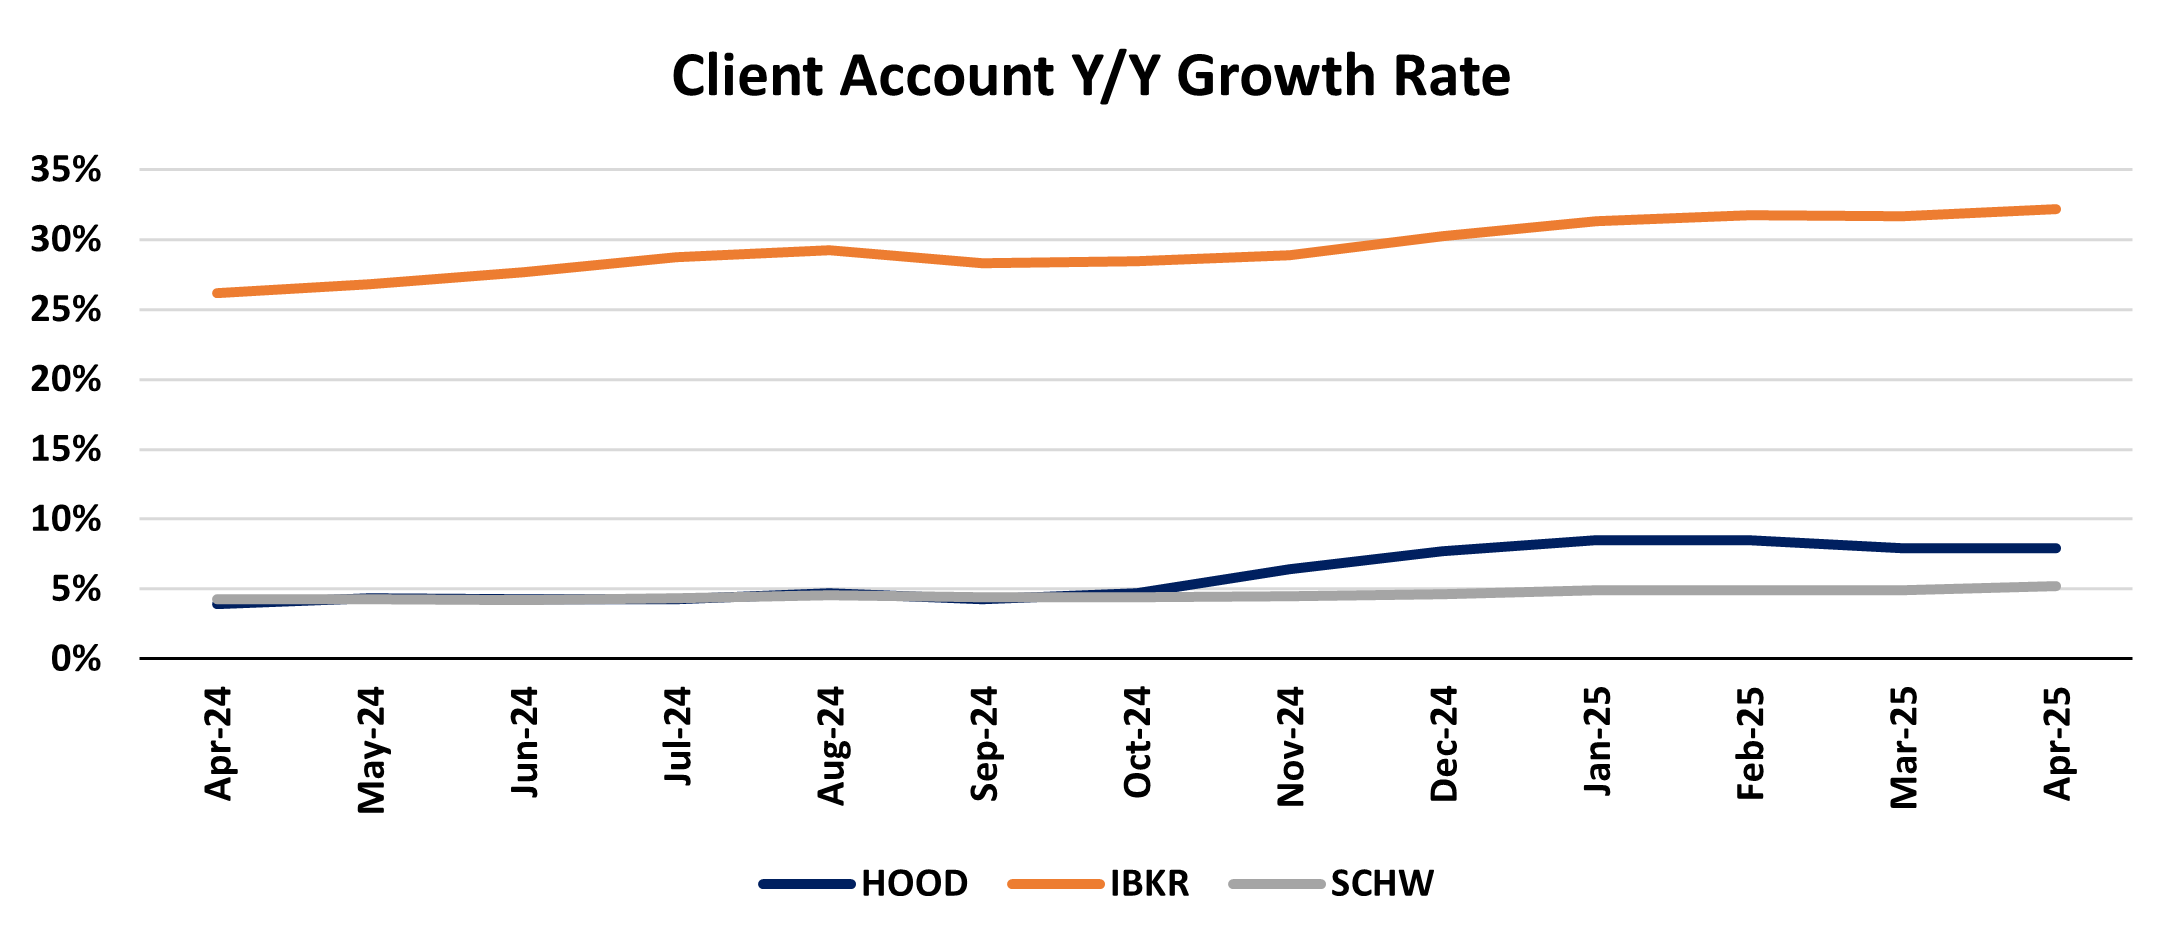
Total Client Accounts:
HOOD – Total Funded Customers of 25.9M
IBKR – Total Accounts of 3.7M
SCHW – Total Client Accounts (incl. banking and retirement plan) 44.8M
HOOD – Funded Customers Y/Y Growth – 7.9%
IBKR – Total Accounts Y/Y Growth – 32.2%
SCHW – Total Client Accounts Y/Y Growth – 5.2%
IBKR continues to bring in new accounts at breakneck pace, far above the account growth seen at HOOD or SCHW. HOOD client account growth really began to break out the past couple quarters with the past 6 months of client account growth over 5%. For the most part, SCHW client accounts are growing roughly inline with its pace of NNA annualized growth (except April’s seasonally slower NNA month).

Source: company documents
Source: company documents
Two notable trends begin to take shape when comparing account growth metrics with annualized NNA growth metrics. First, given HOOD’s NNA growth is far outpacing its Y/Y growth in client accounts, this suggest to me that HOOD is beginning to target larger accounts and move up market as it targets becoming a more robust financial ecosystem. Second, given IBKR’s account growth has, for the most part, far outpaced its estimated NNA growth rate, this suggests to me that IBKR may be moving down market and attempting to bring in accounts with lower overall asset levels (essentially trying to take some of what HOOD has been successful at picking up). This trend can more clearly be seen below…
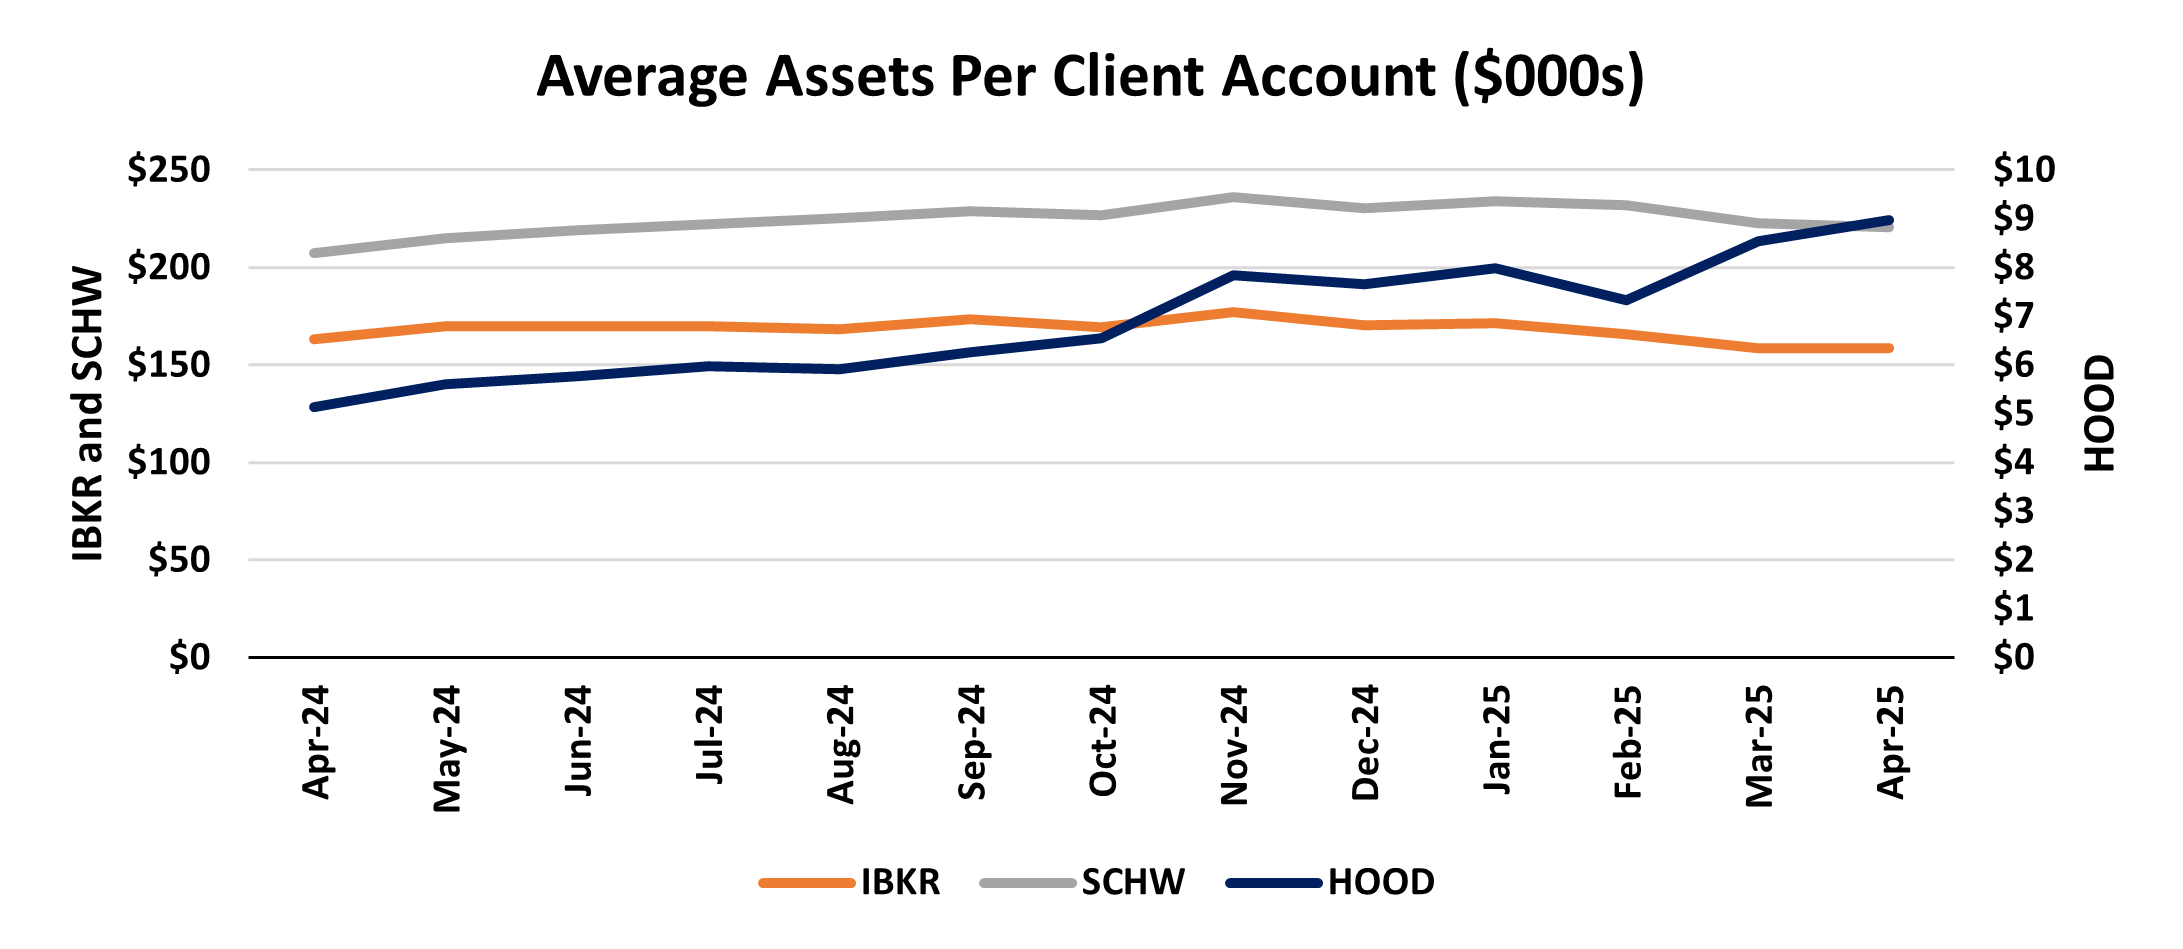
Average Assets Per Account:
HOOD – $8,969
IBKR – $158,479
SCHW – $220,616
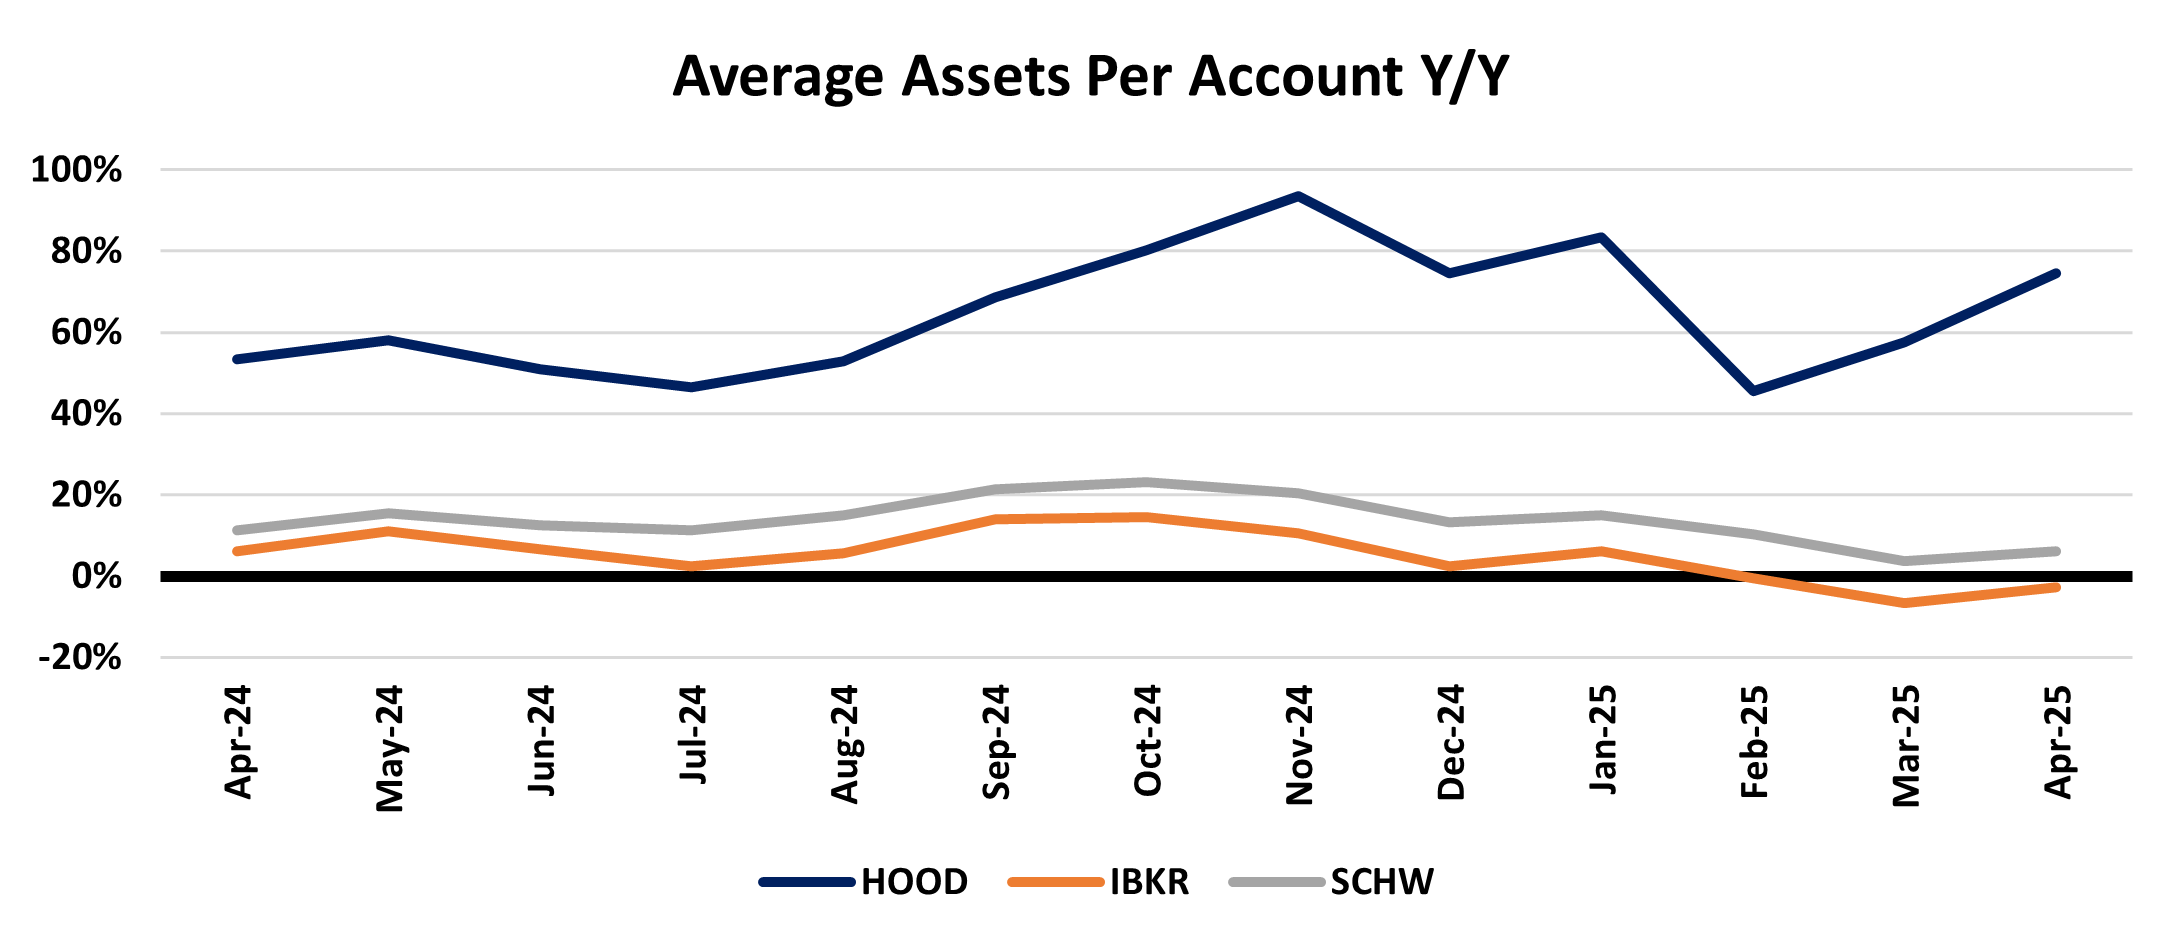
HOOD – Y/Y Growth – 74.6%
IBKR – Y/Y Growth – (2.8%)
SCHW – Y/Y Growth – 6.2%
IBKR’s average assets per client account have begun to decline Y/Y (which should not be the case as markets have risen vs. a year ago, adding to average account value). Meanwhile, HOOD’s average account value has risen dramatically over the past few months. Notably, in its 1Q earnings call, HOOD mentioned that recent promotional activity had helped bring in new accounts with values of >$90k (and some >$180k).
Source: company documents
Similar to the beginning of this note, below I show the same chart, however, instead of putting HOOD on a different axis than IBKR and SCHW I have all on the left axis, just to show the stark difference in average account balances…

Source: company documents
Below is the Y/Y growth in average assets per account, showing HOOD clearly breaking out…
Source: company documents
Consolidated Metrics:
Below is a complete table of all of the metrics discussed above as well as some detail on margin loan trends and cash balance trends. I apologize for how much space this takes up:

Source: company documents
Company Specific Updates for Week Ended May 16, 2025
Exchanges
Cboe Global Markets, Inc. (CBOE)
Expands Data Vantage Sales Team to Strengthen Asia Pacific Presence
Junichi Nakagawa and Samuel Zou appointed Sales Directors in Asia Pacific
Hires reflect growing demand for data, analytics and related services in the region
Supports Cboe’s global growth strategy for Data Vantage
Intercontinental Exchange, Inc. (ICE)
Nasdaq, Inc. (NDAQ)
SET will promote the adoption of Nasdaq’s risk and surveillance platforms within its member community
Partnership focused on strengthening market resilience and integrity
Announces annual meeting of shareholders on June 11 at 8:00am ET
Fixed Income Trading Platforms
MarketAxess Holdings Inc. (MKTX)
Acquires Majority Control of RFQ-hub Holdings LLC
RFQ-hub is a bilateral multi-asset and multi-dealer request for quote (RFQ) platform with a focus on equity and fixed-income listed and OTC derivatives, structured products and ETFs
MKTX holds a 90% controlling stake in RFQ-hub while founding consortium members including Virtu, Citadel Securities, Flow Traders, Jane Street Capital and BlackRock will retain minority stakes and continue to partner with MKTX
Recall on its 1Q25 earnings call, MKTX indicated full year revenue for RFQ-hub was expected to grow 15% - 20% from 2024’s $13M level
Additionally, MKTX anticipated an incremental $7 - $9M in expenses from the acquisition (which are included in MKTX’s updated expense guide for “at the low-end” of the previously disclosed range of $505 - $525M)
Some additional detail from the 1Q25 earnings call can be found here
Online Brokers
Webull Corporation (BULL)
eToro Group Ltd. (ETOR)
Announces Pricing of Upsized Initial Public Offering
ETOR sold 11,923,018 shares at $52.00 in its IPO
Valued the company at $4.3B
For some brief thoughts on the company please see my post from a few weeks ago here
Robinhood Markets, Inc. (HOOD)
All cash purchase price of C$250M ($180M USD)
Expected to close in 2H25
WonderFi operates two of Canada’s longest-standing regulated crypto platforms, Bitbuy and Coinsquare
Cater to institutional and retail customers allowing them to trade and stake crypto assets under an investment dealer license
Offer 61 coins and staking capabilities
Accelerates HOOD’s entry into Canadian market
WonderFi has over C$2.1B ($1.5B USD) in assets under custody, total crypto trading volume in 2024 of C$3.6B ($2.6B USD) and 2024 revenues of C$58M ($41M USD)
This is a relatively small acquisition for HOOD (HOOD has $52B market cap and had $4.4B in cash and equivalents on the balance sheet as of 3/31/25) however I view this as an incremental positive as it expands HOOD’s geographic reach by adding an entirely new geographic customer base as HOOD seeks to become the “number one global financial ecosystem”
Funded customers increased 8% Y/Y to 25.9M
Total Platform Assets ended the month at $232B (+5% M/M, +88% Y/Y)
Net deposits were $6.8B, implying an annualized growth rate of 37%
Margin Balances ended the month at $8.4B (-5% M/M, +105% Y/Y)
Equity trading volumes were $157.8B in April, the highest level since February 2021 (in the height of the meme-stock short squeeze)
Option contracts were 167.5M, the second highest level on record behind only March 2025
Crypto notional volume declined 24% M/M (-15% Y/Y) to $8.6B
Cash Sweep balances ended the month at $28.9B (+2% M/M, +51% Y/Y)
Recall that on its 1Q25 earnings call Robinhood had previewed much of the above figures (as HOOD’s 1Q25 earnings call took place on April 30)
The Charles Schwab Corporation (SCHW)
Announces Redemption of All Outstanding Series G Perpetual Preferred Stock
Total cost to redeem will be $2.5B
After redemption SCHW should still remain within its target Tier 1 leverage ratio range of 6.75% - 7.00%
Lowers SCHW’s quarterly preferred dividend by $33M beginning in 3Q25
Core NNA came in at $2.7B implying an annualized growth rate of 0.3% (note: SCHW typically sees $0 or even negative NNA flows in April during tax disbursement season)
Transactional sweep cash declined $4.5B M/M to $403.3B (also inline with typical seasonality)
Average interest earning assets for the month were $431B (+1% M/M)
Average margin balances declined 6% M/M to $77.5B
Total client assets ended the month at $9.9B (down less than 1% M/M)
Announces Q2 Trader Sentiment Survey Findings
63% say recession is at least somewhat likely; 62% say the same about stagflation
Traders remain resolute – 61% plan to buy the dip if volatility persists
Company Specific Updates Anticipated for the Upcoming Week (Ended May 23, 2025)
Exchanges
None to Note
Fixed Income Trading Platforms
None to Note
Online Brokers
Webull Corporation (BULL)
1Q25 earnings release
Thursday, May 22 post-close
Conference call 5:00pm ET
Next Four Weeks Calendar
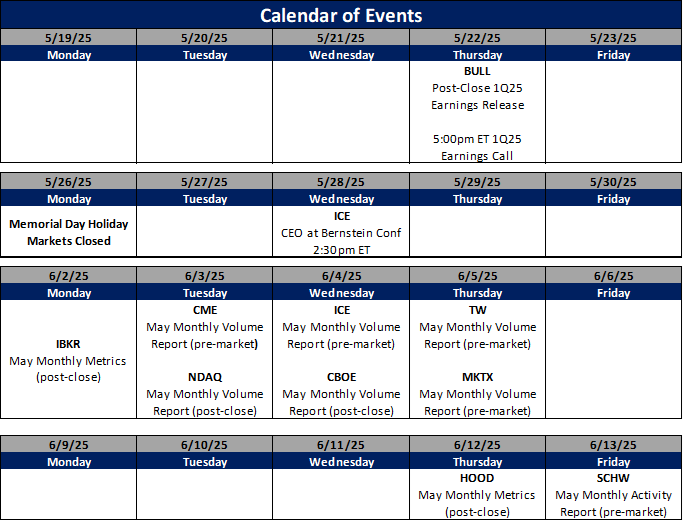
Source: Company press releases and my estimates around timing
Major Macro Updates for Week Ended May 16, 2025
Monthly U.S. Federal Budget (Apr.) – $258B vs. consensus $256B and prior $210B
NFIB Optimism Index (Apr.) – 95.8 vs. consensus 95.0 and prior 97.4
Consumer Price Index (Apr.) – 0.2% vs. consensus 0.2% and prior (0.1%)
Consumer Price Index Y/Y (Apr.) – 2.3% vs. consensus 2.4% and prior 2.4%
Core Consumer Price Index (Apr.) – 0.2% vs. consensus 0.3% and prior 0.1%
Core Consumer Price Index Y/Y (Apr.) – 2.8% vs. consensus 2.8% and prior 2.8%
Initial jobless claims (week ended May 10) – 229k vs. consensus 227k and prior 228k
U.S. Retail Sales (Apr.) – 0.1% vs. consensus 0.1% and prior 1.4%
Retail Sales Minus Autos (Apr.) – 0.1% vs. consensus 0.3% and prior 0.8%
Producer Price Index (Apr.) – 0.5% vs. consensus 0.3% and prior (0.0%)
Core Producer Price Index (Apr.) – (0.2%) vs. consensus 0.3% and prior 0.2%
Producer Price Index Y/Y (Apr.) – 2.4% vs. prior 3.4%
Core Producer Price Index Y/Y (Apr.) – 2.9% vs. prior 3.5%
Empire State Manufacturing Survey (May) – (9.2) vs. consensus (9.0) and prior (8.1)
Philadelphia Fed Manufacturing Survey (May) – (4.0) vs. consensus (10.0) and prior (26.4)
Industrial Production (Apr.) – 0.0 vs. consensus 0.1% and prior (0.3%)
Capacity Utilization (Apr.) – 77.7% vs. consensus 77.8% and prior 77.8%
Business Inventories (Mar.) – 0.1% vs. consensus 0.2% and prior 0.2%
Homebuilder Confidence Index (May) – 34 vs. consensus 40 and prior 40
Import Price Index (Apr.) – 0.1% vs. consensus (0.4%) and prior (0.4%)
Import Price Index Minus Fuel (Apr.) – 0.4% vs. prior (0.1%)
Housing Starts (Apr.) – 1.36M vs. consensus 1.36M and prior 1.34M
Building Permits (Apr.) – 1.41M vs. consensus 1.45M and prior 1.48M
Preliminary Consumer Sentiment (May) – 50.8 vs. consensus 53.2 and prior 52.2
Major Macro Updates Scheduled for the Upcoming Week (Ended May 23, 2025)
Monday, May 19
U.S. Leading Economic Indicators (Apr.) – consensus (0.9%) and prior (0.7%)
Tuesday, May 20
None to Note
Wednesday, May 21
None to Note
Thursday, May 22
Initial jobless claims (week ended May 17) – consensus 230k and prior 229k
S&P Flash U.S. Services PMI (May) – consensus 50.8 and prior 50.8
S&P Flash U.S. Manufacturing PMI (May) – consensus 49.8 and prior 49.8
Existing Home Sales (Apr.) – consensus 4.12M and prior 4.02M
Friday, May 23
New Home Sales (Apr.) – consensus 700k and prior 724k
Exchange Volume Update
Exchange Volumes Over Past Week and W/W Trends
For the week ended May 16, 2025, volumes increased W/W despite volatility falling as investors likely repositioned portfolios for more of a risk-on environment following the China-U.S. trade war pause announced on Sunday, May 11.
The average VIX for the week was down 22% from the prior week, average realized volatility declined 34% W/W, average volatility of volatility (as measured by the VVIX) was down 7% W/W and the average MOVE index (U.S. Treasuries volatility) was down 2% W/W.
Futures average daily volumes (ADV) were higher as CBOE futures volumes were up 41% W/W, CME futures volumes were up 14% W/W, and ICE futures volumes were up 15% W/W.
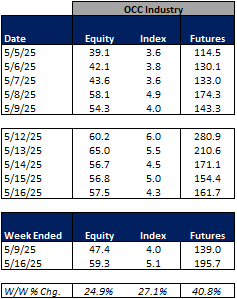
Total U.S. Equities ADV was up 22%W/W, mainly driven by on-exchange trading as TRF volumes were up 21% W/W. Industry equity options volumes were up 25% W/W while index options volumes increased 27% W/W.
For further detail on weekly volume trends by exchange and by product line please see the charts below.
CME Futures Volumes (M)
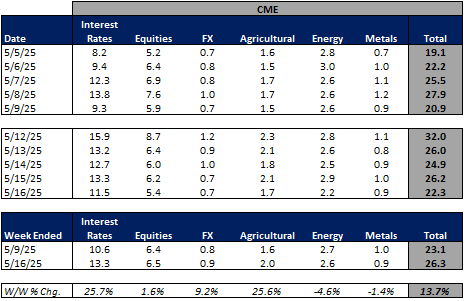
Source: Company Daily Volume Releases
ICE Futures (M), U.S. Equities (B) and U.S. Equity Options (M) Volumes

Source: Company Daily Volume Releases, Cboe Global Markets and OCC
CBOE Options (M), Futures (K), U.S. Equity (B), and FX Volumes ($B)
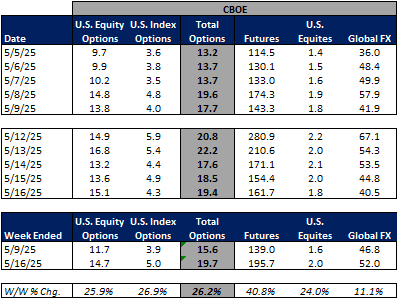
Source: Company Daily Volume Releases and OCC
NDAQ U.S. Equity (B) and Option (M) Volumes

Source: Cboe Global Markets and OCC
U.S. Total Industry Equity Volumes (B)
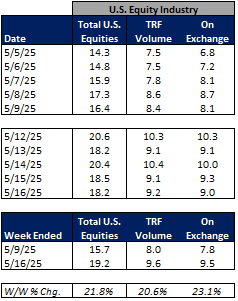
Source: Cboe Global Markets
U.S. Total Industry Equity Option and Index Option Volumes (M)
Source: OCC
Volatility Metrics

Source: Yahoo Finance
Exchange Volumes MTD / QTD / YTD Trends
Exchange volumes are tracking lower in May-to-date relative to April but are generally higher Y/Y. This comes as volatility is up MTD on a Y/Y basis.
The average VIX in May-to-date is up 62% Y/Y while realized volatility is up 156% Y/Y and volatility of volatility is up 24% Y/Y. Treasuries volatility is higher as well Y/Y as the average MOVE index in May-to-date is up 9% Y/Y.
Futures volumes are mixed Y/Y as ICE futures MTD ADV is up 16% vs. May 2024 ADV. Meanwhile, CME ADV is down 4% Y/Y while CBOE futures ADV is down 23% Y/Y.
In terms of equities and options volumes, total U.S. equities ADV is up 39% MTD while option volumes are up 33% for equity options and up 17% for index options.
For further details on MTD / QTD and YTD ADV please see the charts below.
CME Futures Volumes (M)
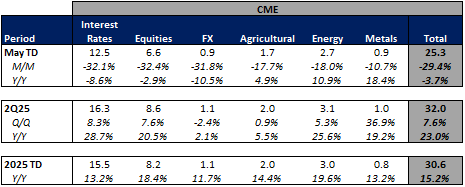
Source: Company Daily Volume Releases
ICE Futures (M), U.S. Equities (B) and U.S. Equity Options (M) Volumes
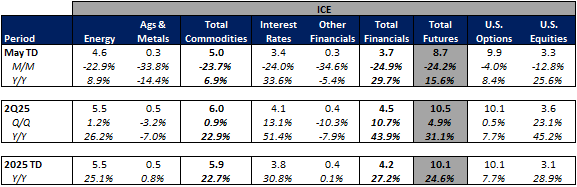
Source: Company Daily Volume Releases, Cboe Global Markets and OCC
CBOE Options (M), Futures (K), U.S. Equity (B), and FX Volumes ($B)
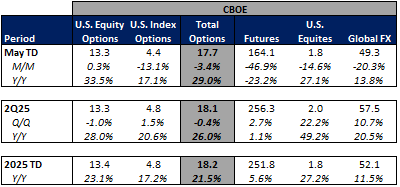
Source: Company Daily Volume Releases and OCC
NDAQ U.S. Equity (B) and Option (M) Volumes
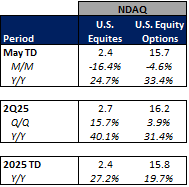
Source: Cboe Global Markets and OCC
U.S. Total Industry Equity Volumes (B)

Source: Cboe Global Markets
U.S. Total Industry Equity Option and Index Option Volumes (M)
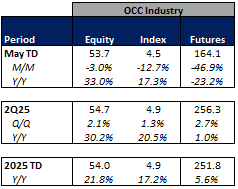
Source: OCC
Volatility Metrics

Source: Yahoo Finance
Major Indices, Interest Rates and Company Share Price Trends
The market rose on the week (up 530 bps W / W) as the environment generally calmed following the announcement that China and the U.S. had reached a 90 day pause on tariffs and lowered tariff rates by 115 percentage points for the next 90 days. While much remains to be hashed out the announcement brought back a risk on sense to the market as volatility cooled and risk assets performed well.
In terms of the companies I follow the eBrokers performed well following the trade war de-escalation as asset prices rose and market expectations for rate cuts fell. IBKR and HOOD both rose 13% on the week while SCHW was up 5%. Within the exchanges, CBOE fell 4% and CME fell 3% as volatility cooled while ICE was down 1% and NDAQ increased 3%. MKTX also declined 6% due to declining volatility while TW was down 2% on the week.
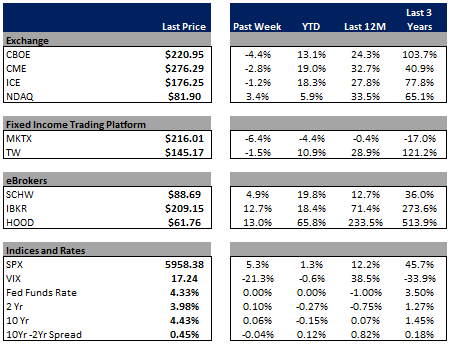
Source: Yahoo Finance, FRED, U.S. Department of the Treasury
Comp Sheet

Source: PitchBook
Guidance Tracker
Exchanges
Cboe Global Markets, Inc. (CBOE)
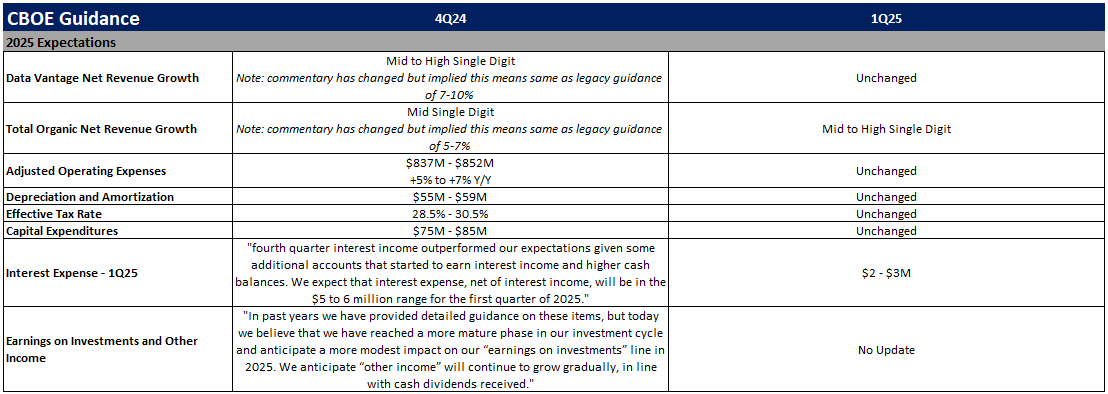
Source: Company documents
Note: CBOE provided additional guidance points / commentary on its 1Q25 earnings call, but key annual highlights are included above for the sake of simplicity
CME Group Inc. (CME)

Source: Company documents
Note: CME provided additional guidance points / commentary on its 1Q25 earnings call, but key annual highlights are included above for the sake of simplicity
Intercontinental Exchange, Inc. (ICE)

Source: Company documents
Note: ICE provided additional guidance points / commentary on its 1Q25 earnings call, but key annual highlights are included above for the sake of simplicity
Nasdaq, Inc. (NDAQ)

Source: Company documents
Note: NDAQ provided additional guidance points / commentary on its 1Q25 earnings call, but key annual highlights are included above for the sake of simplicity
Fixed Income Trading Platforms
MarketAxess Holdings Inc. (MKTX)

Source: Company documents
Note: MKTX provided additional guidance points / commentary on its 1Q25 earnings call, but key annual highlights are included above for the sake of simplicity
Tradeweb Markets Inc. (TW)

Source: Company documents
Note: TW provided additional guidance points / commentary on its 1Q25 earnings call, but key annual highlights are included above for the sake of simplicity
Online Brokers
Robinhood Markets, Inc. (HOOD)

Source: Company documents
Note: HOOD provided additional guidance points / commentary on its 1Q25 earnings call, but key annual highlights are included above for the sake of simplicity
Interactive Brokers Group, Inc. (IBKR)
Source: Company documents
Note: IBKR provided additional guidance points / commentary on its 1Q25 earnings call, but key annual highlights are included above for the sake of simplicity
The Charles Schwab Corporation (SCHW)
