


Weekly Recap for Week Ended March 28, 2025
Weekly Recap of Major Micro / Macro Data Points and Things to Look Forward to in the Week Ahead

Significant News / Developments from Week Ended Mar. 28, 2025
eToro Publicly Files for IPO in the U.S.
On Monday, March 24, Israeli retail trading platform eToro publicly filed for a U.S. IPO. eToro (ETOR 0.00%↑) is an online investment platform catering to retail investors allowing users to trade equities, commodities, currencies and crypto as well as derivatives across all the same products. The company had 3.5 million Funded Accounts as of December 31, 2024, and $16.6 billion in Assets Under Administration. eToro’s client base is primarily located in Europe and the U.K. with 70% of funded accounts located in the region. Asia Pacific makes up 16% of eToro’s funded accounts with 10% located in the Americas and the remaining 4% in the Middle East and Africa. From a Net Contribution perspective (net revenue and income less the cost of revenue from cryptoassets and margin interest expense) 42% of net contribution came from equities, commodities and currencies trading in 2024 followed by 25% from cryptoassets trading, 23% from net interest, 9% from eToro Money (currency conversion revenue) and 1% from subscriptions and other.
Over the past two years, eToro has grown Funded Accounts at a CAGR of 11%, and put up 15% account growth in 2024. Meanwhile, total Assets Under Administration has grown at a 69% CAGR over the same time period, with 73% growth in 2024. This has translated into Net Contribution growth at a 16% CAGR, with 2024 Net Contribution of $787 million (+41% Y/Y). Admittedly, much of the Net Contribution growth in 2024 was due to a flurry of cryptoasset activity as cryptoasset Net Contribution increased 245% Y/Y due to some very large spikes in activity in 1Q24 and 4Q24.
Comparing eToro’s financials to some of the publicly traded online brokers we can see that eToro’s client account growth rate far outpaced The Charles Schwab Corporation (SCHW 0.00%↑) (+5%) and Robinhood Markets, Inc. (HOOD 0.00%↑) (+8%) in 2024 but came in below that of Interactive Brokers Group, Inc. (IBKR 0.00%↑) (+30%). On the client asset growth side, eToro underperformed HOOD (+88%) but outpaced SCHW (+19%) and IBKR (+33%). eToro and HOOD certainly cater more to the retail trader as average assets per account at eToro is currently $4,800 and HOOD is currently $7,700 (as of December 31, 2024). Meanwhile, IBKR caters to more of the professional trader with average assets per account of $170k while SCHW caters more to the affluent self-directed investor and independent advisors with average assets per account of $230k.
In terms of profitability, eToro generates the highest revenue per average client assets among the group with a ROCA (revenue on average client assets) of 6.01% in 2024 while SCHW generated the lowest at 0.21% (much of SCHW’s revenue generation from client assets come from lower yielding asset management fees as well as earning income at SCHW’s bank as opposed to eToro where much of Net Contribution is related to client trading activity). On the other hand, eToro also has the highest expense base on average client assets with an EOCA (expenses on average client assets) of 1.87% in 2024 while SCHW has the lowest at 0.13%.
Online Broker Key Metrics

Source: Company filings
eToro initially attempted to go public in 2022 via SPAC with an anticipated valuation of $8.8B, though that deal was terminated with markets in a downturn during the summer of 2022. Subsequently, in early 2023, eToro raised a funding round at a valuation of $3.5 billion. Based on news reports, eToro is hoping to fetch >$5 billion in this latest IPO attempt.
Given where the peer group is trading at 27x LTM earnings and 8x LTM Sales I think a $5 billion valuation is potentially achievable for the company given the impressively high growth profile we’ve seen in both client assets and client accounts. However, looking at forward multiples, the peer group currently trades at 23x NTM earnings. If I very simply assume normalized revenue (ex-the large cryptoasset trading related spikes in 1Q24 and 4Q24) grows at 14.5% Y/Y (inline with 2024 Funded Account Growth) and normalized expenses grow at 2.5% Y/Y (inline with the 2024 growth rate) I come up with 2025 net income of $154 million which would imply a valuation of $3.6B at the peer group average multiple. Please note, these assumptions are based on an extremely basic model so actual 2025 revenue, expense and net income results could vary dramatically from what I’ve described here.
That being said, last week I wrote some brief thoughts on Kraken’s acquisition of NinjaTrader. Looking purely on an EV / Client Account basis (absolutely not my preferred nor suggested valuation metric), because there is limited financial data available for NinjaTrader, a $5B price tag for eToro would put the company at roughly the same valuation as HOOD and about nearly 2x the valuation of NinjaTrader.
eToro Potentail Valuation Metrics
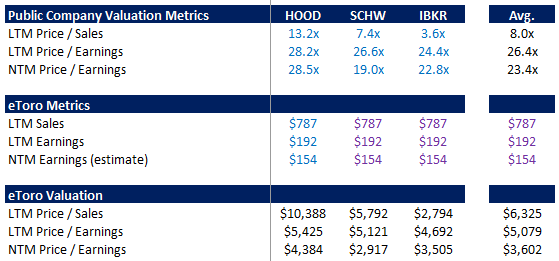
Source: Tikr.com, company filings and my estimates
eToro and NinjaTrader Valuation Per Account vs. Peer Group
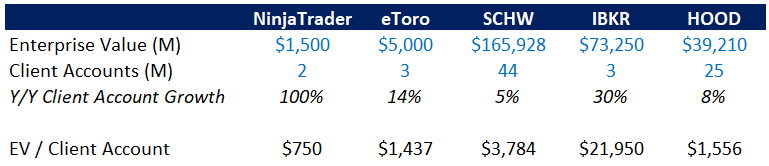
Source: Tikr.com and company filings
Company Specific Updates for Week Ended Mar. 28, 2025
Exchanges
CME Group Inc. (CME)
Introducing Tokenization Technology Using Google Cloud's Universal Ledger
GCUL is a programmable, distributed ledger that simplifies management of accounts and assets and facilitates transfers on a private, permissioned network
Expected to deliver efficiencies for collateral, margin, settlement and fee payments
Will be testing with market participants later this year and planned launch is expected in 2026
Nasdaq, Inc. (NDAQ)
Announced 1Q25 Earnings Conference Call Date
Thursday, April 24 8:00am ET
Intercontinental Exchange, Inc. (ICE)
ICE and Circle sign MOU to Explore Product Innovation Based on Circle’s USDC and USYC Digital Assets
Circle’s USDC is a fully reserved stable coin that is redeemable 1:1 for US dollars
As of March 26 over $60B of USDC is in circulation
Majority of USDC reserves are invested in the Circle Reserve Fund, an SEC registered government money market fund
Circle and ICE plan to collaborate to explore applications for using Circle’s stablecoins and other products within ICE’s derivatives exchanges, clearinghouses, data services, and other markets
Fixed Income Trading Platforms
Tradeweb Markets Inc. (TW)
Online Brokers
Robinhood Markets, Inc. (HOOD)
Announced amended credit agreement and board appointment
Total available revolving credit facility amounts to $3.975B across 3 tranches
In a blog post, HOOD announced the appointment of John Hegeman to the Board of Directors
Mr. Hegeman currently serves as Chief Revenue Officer at Meta
Announces Robinhood Strategies, Robinhood Banking, and Robinhood Cortex
Robinhood Strategies is a wealth management robo advisory service
Annual fees of 0.25% with a capo of $250 for Robinhood Gold members
Offers mix of single stocks and ETFs and portfolios are actively managed
Will offer tax advantages with tax loss harvesting
Robinhood Banking will offer traditional checking and savings accounts
Savings accounts currently will receive 4.0% APY
Offers up to $2.5M in FDIC insurance
Robinhood Cortex is an AI investment tool launching later this year
Includes Stock Digests and Trade Builder to help answer why stocks are moving the way they are on a given day and suggest new strategies to align with clients’ goals
The Charles Schwab Corporation (SCHW)
Announces Its Spring Business Update
Thursday, April 17 at 8:30am ET
Company Specific Updates Anticipated for the Upcoming Week (Ended Apr. 4, 2025)
As we near the turn of the calendar on another month we begin to gear up for some final monthly metrics for the quarter from the exchanges and trading companies in the week ahead followed closely over the next few weeks by 1Q25 earnings reports beginning to roll in. The week ahead will likely be categorized by earnings previews coming out of sell-side analysts (if they have not done so already).
Exchanges
Cboe Global Markets, Inc. (CBOE)
March volume release expected Thursday, April 3 (post-close)
CME
March volume release expected Wednesday, April 2 (pre-market)
ICE
March volume release expected Thursday, April 3 (pre-market)
Fixed Income Trading Platforms
MarketAxess Holdings Inc. (MKTX)
March volume release expected Thursday, April 3 (pre-market)
TW
March volume release expected Friday, April 4 (pre-market)
Online Brokers
Interactive Brokers Group, Inc. (IBKR)
March metrics release expected Tuesday, April 1 (post-close)
Next Four Weeks Calendar

Source: Company press releases and my estimates around timing
Major Macro Updates for Week Ended Mar. 28, 2025
S&P Flash U.S. Services PMI (Mar.) – 54.3 vs. consensus 51.5 and prior 51.0
S&P Flash U.S. Manufacturing PMI (Mar.) – 49.8 vs. consensus 51.5 and prior 52.7
S&P Case-Shiller Home Price Index (Jan.) – 4.7% vs. consensus 4.6% and prior 4.5%
Consumer Confidence (Mar.) – 92.9 vs. consensus 93.5 and prior 100.1
New Home Sales (Feb.) – 676k vs. consensus 677k and prior 664k
Durable Goods Orders (Feb.) – 0.9% vs. consensus (1.0%) and prior 3.3%
Durable Goods Minus Transportation (Feb.) – 0.7% vs. prior 0.1%
Initial jobless claims (week ended Mar. 22) – 224k vs. consensus 226k and prior 225k
GDP Second Revision (4Q24) – 2.4% vs. consensus 2.3% and prior 2.3%
Advanced U.S. Trade Balance in Goods (Feb.) – $147.9B vs. prior ($155.6B)
Advanced Retail Inventories (Feb.) – 0.1% vs. prior 0.1%
Advanced Wholesale Inventories (Feb.) – 0.3% vs. prior 0.8%
Pending Home Sales (Feb.) – 2.0% vs. consensus 1.0% and prior (4.6%)
Personal Income (Feb.) – 0.8% vs. consensus 0.4% and prior 0.7%
Personal Spending (Feb.) – 0.4% vs. consensus 0.5% and prior (0.3%)
PCE Index (Feb.) – 0.3% vs. consensus 0.3% and prior 0.3%
PCE Year over Year (Feb.) – 2.5% vs. consensus 2.5% and prior 2.5%
Core PCE Index (Feb.) – 0.4% vs. consensus 0.3% and prior 0.3%
Core PCE Year over Year (Feb.) – 2.8% vs. consensus 2.7% and prior 2.7%
Consumer Sentiment Final (Mar.) – 57.0 vs. consensus 57.9 and prior 57.9
Major Macro Updates Scheduled for the Upcoming Week (Ended Apr. 4, 2025)
Monday, Mar. 31
Chicago Business Barometer (Mar.) – consensus 43.6 and prior 45.5
Tuesday, Apr. 1
S&P Final U.S. Manufacturing PMI (Mar.) – consensus 49.8 and prior 49.8
Construction Spending (Feb.) – consensus 0.3% and prior (0.2%)
ISM Manufacturing (Mar.) – consensus 49.5% and prior 50.3%
Job Openings (Feb.) – consensus 7.7M and prior 7.7M
Auto Sales (Mar.) – prior 16.0M
Wednesday, Apr. 2
ADP Employment (Mar.) – consensus 120k and prior 77k
Factory Orders (Feb.) – consensus 0.6% and prior 1.7%
Thursday, Apr. 3
Initial jobless claims (week ended Mar. 29) – consensus 226k and prior 224k
U.S. Trade Deficit (Feb.) – consensus $123.0B and prior $131.4B
S&P Final U.S. Services PMI (Mar.) – consensus 54.1 and prior 54.3
ISM Services (Mar.) – consensus 53.0% and prior 53.5%
Friday, Apr. 4
U.S. Employment Report (Mar.) – consensus 140k and prior 151k
U.S. Unemployment Rate (Mar.) – consensus 4.1% and prior 4.1%
U.S. Hourly Wages (Mar.) – consensus 0.3% and prior 0.3%
Hourly Wages Year over Year (Mar.) – consensus 3.9% and prior 4.0%
Exchange Volume Update
Exchange Volumes Over Past Week and W/W Trends
For the week ended March 28, 2025, volumes and volatility were both mixed week over week.
The average VIX for the week was down 8% from the prior week, average realized volatility was up 1% W/W, average volatility of volatility (as measured by the VVIX) was down 3% W/W and the average MOVE index (U.S. Treasuries volatility) was down 2% W/W.
Futures average daily volumes (ADV) declined as CBOE futures volumes were down 14% W/W, CME futures volumes were down 15% W/W, and ICE futures volumes were down 6% W/W.
Total U.S. Equities ADV was down 4% W/W, mainly driven by on-exchange trading as TRF volumes were up 2% W/W. Industry equity options volumes were up 1% W/W while index options volumes increased 5% W/W.
For further detail on weekly volume trends by exchange and by product line please see the charts below.
CME Futures Volumes (M)

Source: Company Daily Volume Releases
ICE Futures (M), U.S. Equities (B) and U.S. Equity Options (M) Volumes
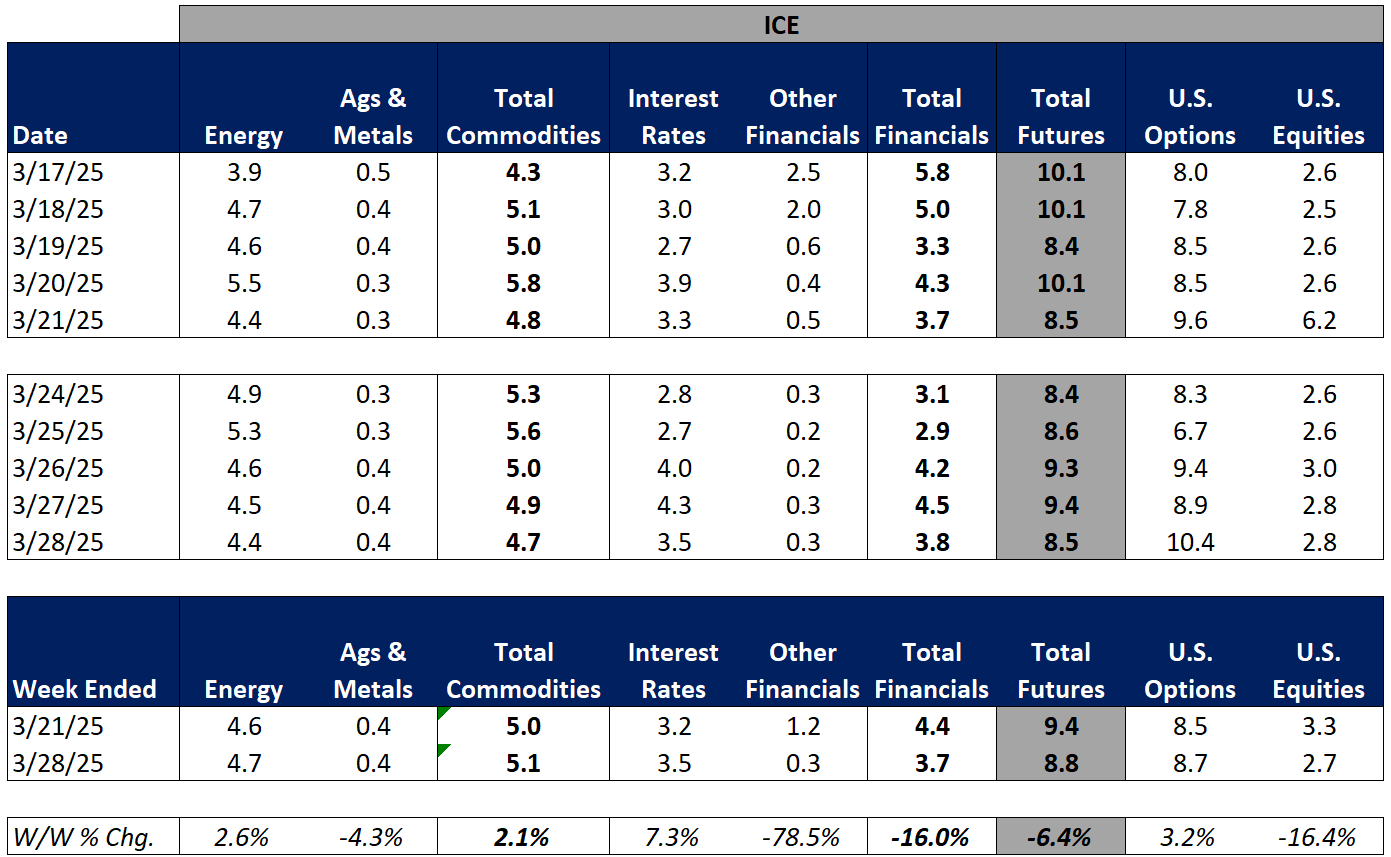
Source: Company Daily Volume Releases, Cboe Global Markets and OCC
CBOE Options (M), Futures (K), U.S. Equity (B), and FX Volumes ($B)

Source: Company Daily Volume Releases and OCC
NDAQ U.S. Equity (B) and Option (M) Volumes

Source: Cboe Global Markets and OCC
U.S. Total Industry Equity Volumes (B)

Source: Cboe Global Markets
U.S. Total Industry Equity Option and Index Option Volumes (M)

Source: OCC
Volatility Metrics

Source: Yahoo Finance
Exchange Volumes MTD / QTD / YTD Trends
Exchange volumes are tracking higher in March-to-date. This comes as volatility is up significantly MTD on a Y/Y basis.
The average VIX in March-to-date is up 58% Y/Y while realized volatility is up 68% Y/Y and volatility of volatility is up 27% Y/Y. Treasuries volatility is higher as well Y/Y as the average MOVE index in March-to-date is up 2% Y/Y.
Futures volumes are higher Y/Y as ICE futures MTD ADV is up 32% vs. March 2024 ADV. Meanwhile, CME ADV is up 27% Y/Y while CBOE futures ADV is up 32% Y/Y.
In terms of equities and options volumes, total U.S. equities ADV is up 33% MTD while option volumes are up 24% for equity options and up 29% for index options.
For further details on MTD / QTD and YTD ADV please see the charts below.
CME Futures Volumes (M)

Source: Company Daily Volume Releases
ICE Futures (M), U.S. Equities (B) and U.S. Equity Options (M) Volumes

Source: Company Daily Volume Releases, Cboe Global Markets and OCC
CBOE Options (M), Futures (K), U.S. Equity (B), and FX Volumes ($B)

Source: Company Daily Volume Releases and OCC
NDAQ U.S. Equity (B) and Option (M) Volumes

Source: Cboe Global Markets and OCC
U.S. Total Industry Equity Volumes (B)

Source: Cboe Global Markets
U.S. Total Industry Equity Option and Index Option Volumes (M)
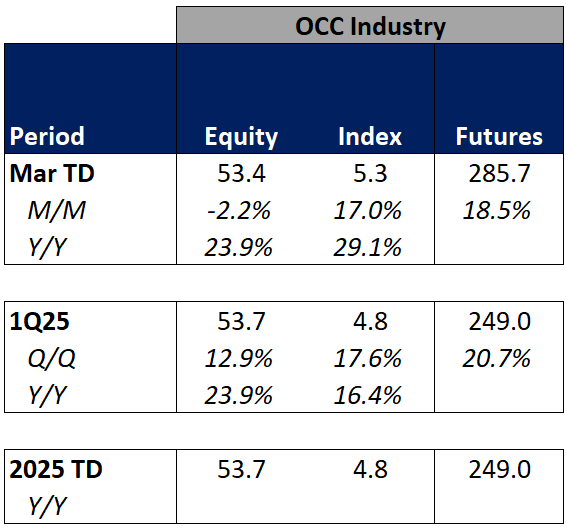
Source: OCC
Volatility Metrics

Source: Yahoo Finance
Major Indices, Interest Rates and Company Share Price Trends
Markets ended the week lower with the S&P down 150bps W/W. The week was highlighted by Trump’s announcement of 25% tariffs on all autos produced outside the United States which reignited trade war fears in the market. Additionally, on Friday, the PCE index came in above expectations, rising 2.8% Y/Y in February vs. 2.7% in January and consumer sentiment fell more than expected which caused concerns of stagflation.
In terms of the companies I follow, the online brokers showed the weakest performance (-1% to -5%) on broad economic concerns. Within the exchanges, CBOE showed the strongest performance, closing out the week up 3%. On the Fixed Income Trading Platform side, TW performed the best, increasing 3% on limited news.

Source: Yahoo Finance, FRED, U.S. Department of the Treasury
Comp Sheet

Source: PitchBook
Guidance Tracker
Exchanges
Cboe Global Markets, Inc. (CBOE)

Source: Company documents
Note: CBOE provided additional guidance points / commentary on its 4Q24 earnings call, but key annual highlights are included above for the sake of simplicity
CME Group Inc. (CME)

Source: Company documents
Note: CME provided additional guidance points / commentary on its 4Q24 earnings call, but key annual highlights are included above for the sake of simplicity
Intercontinental Exchange, Inc. (ICE)

Source: Company documents
Note: ICE provided additional guidance points / commentary on its 4Q24 earnings call, but key annual highlights are included above for the sake of simplicity
Nasdaq, Inc. (NDAQ)

Source: Company documents
Note: NDAQ provided additional guidance points / commentary on its 4Q24 earnings call, but key annual highlights are included above for the sake of simplicity
Fixed Income Trading Platforms
MarketAxess Holdings Inc. (MKTX)

Source: Company documents
Note: MKTX provided additional guidance points / commentary on its 4Q24 earnings call, but key annual highlights are included above for the sake of simplicity
Tradeweb Markets Inc. (TW)

Source: Company documents
Note: TW provided additional guidance points / commentary on its 4Q24 earnings call, but key annual highlights are included above for the sake of simplicity
Online Brokers
The Charles Schwab Corporation (SCHW)
