


Weekly Recap for Week Ended May 30, 2025
Weekly Recap of Major Micro / Macro Data Points and Things to Look Forward to in the Week Ahead

Significant News / Developments from Week Ended May 30, 2025
HOOD Valuation is Truly Astounding
I posted this on X (Twitter) at the end of last week and continue to scratch my head over this one.

HOOD 0.00%↑’s valuation has absolutely exploded over the last 12 months, expanding from about 25x NTM EPS to currently about 47x. This compares to IBKR 0.00%↑’s valuation expanding from 19x to 29x and SCHW 0.00%↑’s valuation moving from 20x to … 20x.
HOOD, SCHW, IBKR Price to NTM EPS
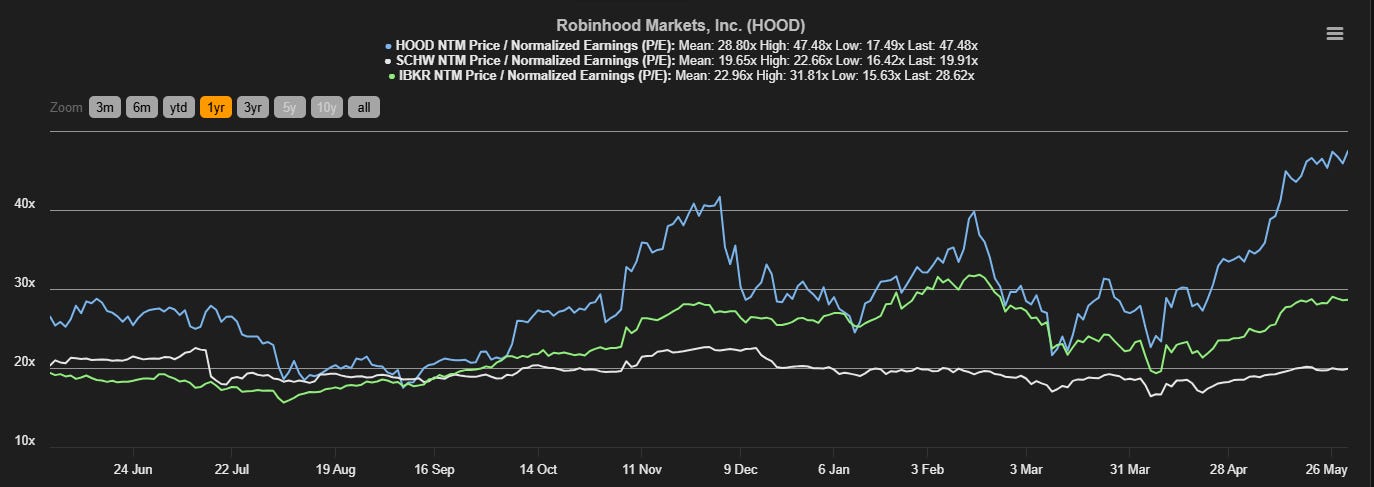
Source: TIKR.com
Granted, the company posted two strong quarters in a row, putting up revenue growth of 115% in 4Q24 and 50% in 1Q25 and adjusted EBITDA margins of 53% in 4Q24 and 43% in 1Q25 (note: I am not adding back SBC in these calcs) which were both the highest levels we’ve seen. Additionally, asset gathering trends have been truly impressive (as I’ve mentioned here and here), with annualized NNA growth rates consistently exceeding 20% for the past 17 months. However, much of the performance (both revenue growth and margin expansion) over the past two quarters was driven by strong trading performance, primarily within crypto, but also across the board due to elevated volatility. If I were to “normalize” just the crypto transaction revenues for the past two quarters and assume crypto revenue grew inline with the growth in equity and options transaction-based revenues year over year, total revenue growth in 4Q24 falls to 57% from 115% and total revenue growth in 1Q25 falls to 40% from 50%. Note that this “normalization” is still aggressive given the volumes seen across equities and options as well.
HOOD Revenue Disaggregation
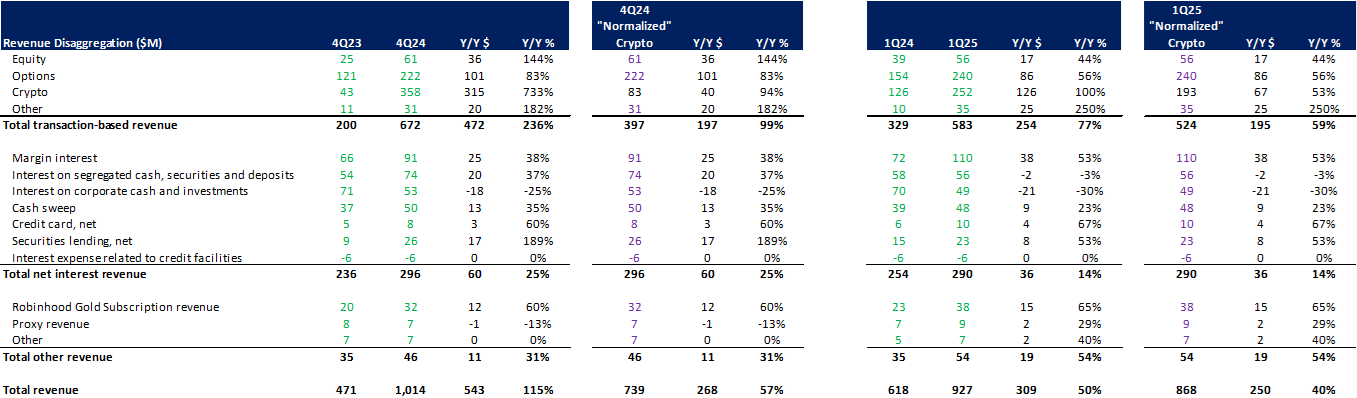
Source: company documents and my estimates
My point in showing this is I truly have no idea how consensus forecasts for 2025 and 2026 are shaking out where they are now. In my HOOD model, I am normalizing the trading environment after 2Q25 (second quarter to date is still pretty strong for trading) but still baking in fairly aggressive growth assumptions for transaction activity (and average interest earning assets and other revenue) off this normalized base, given the strong account / NNA growth HOOD has put up and I can’t get anywhere near the consensus revenue forecasts for ’25 and ’26.
Given this, the multiple expansion is even more mindboggling, as I see downside to EPS! I can get on board with bidding up the multiple if you have line of sight to upward revisions but that just doesn’t seem to be the case here. This is probably going to be an awesome short, if you can hold on past retail traders bidding this to the moon. I personally would pair this against SCHW (which I’ve been long for a while) as SCHW EPS actually will likely grow 30%+ in 2025 and 15%+ in 2026 due to the balance sheet dynamics SCHW has working in its favor right now. Of note, I have absolutely been burned in the past by looking at an idea (long or short) based mainly on a wonky looking valuation. In my mind this is not the case here, the fundamentals in no way back this one up.
The only caveat to this is after some twitter scrolling it sounds like a few people are speculating HOOD could be included in the S&P 500 at the next rebalance. Unclear the reliability of those speculations but if that’s the case there could be some irrational buying in the coming days (rebalance announcement will likely come on Friday, June 6 I believe). The frustrating thing to me about this irrational buying is it has been occurring since COIN 0.00%↑ was announced to be included in the S&P 500 on May 12. Following the announcement, both HOOD and COIN were up materially on May 13 and HOOD has continued to be bid up since, with performance in the time since May 12 almost matching that of COIN (which popped 24% in May 13 vs. HOOD up 9% that day). In the time since the announcement, COIN’s multiple, on 2026 EPS, initially expanded to about 31x and has since remained in that same territory. Meanwhile, HOOD’s multiple initially expanded to 43x and has continued to increase to now over 45x. Nothing for either of these companies has changed fundamentally. So they just get to benefit from five turns (15-20%) of multiple expansion for being included in the S&P? With all this being said, do with the above information as you see fit. I’m annoyed.
HOOD and COIN Performance (Indexed to 100 at May 12 Close)

Source: Yahoo Finance
HOOD and COIN 2026 Earnings Multiples Since May 12

Source: Yahoo Finance
Company Specific Updates for Week Ended May 30, 2025
Exchanges
Cboe Global Markets, Inc. (CBOE)
Announces Departure of Global President Dave Howson
Mr. Howson has been Global President of CBOE in Chicago for the past 3 years
Leaving company to return to UK and be closer to family
Effective Date August 1, 2025
Cathy Clay, current EVP and Global Head of Derivatives, will see role expanded to now also provide oversight of the Cboe Data Vantage business
Chris Isaacson, current EVP and COO, will see role expanded to now oversee Cash Equities, Global FX and Clearing
My speculation is that he announced his departure following CBOE’s board opting for an external candidate (and strong industry veteran) for the full time CEO position (announced here), but I could be wrong in that speculation
CME Group Inc. (CME)
New currencies include Arbitrum, Ondo, NEAR and Sui
(TBH I have never heard of any of these currencies)
Reference rates and indices are not tradable futures products (at this time – my speculation)
CME / CF Benchmark will now include 28 cryptocurrencies covering 96% of the investable crypto market cap
Chairman and CEO to Present at Piper Sandler Global Exchange and Trading Conference
Thursday, June 5, 1:30pm ET
Nasdaq, Inc. (NDAQ)
CEO to Present at Piper Sandler Global Exchange and Trading Conference
Thursday, June 5, 2:30pm ET
President to Present at Morgan Stanley US Financials Conference
Tuesday, June 10, 9:45pm ET
Fixed Income Trading Platforms
Tradeweb Markets Inc. (TW)
Appoints Sherry Marcus as Head of AI
Ms. Marcus joins Tradeweb from Amazon Web Services, where she led the 300-person science and data team behind Amazon Bedrock
Previously, she was a Managing Director, Data and AI at BlackRock
Ms. Marcus also held various senior positions across financial services, including serving as Chief Data Analytics Officer at Millennium Partners and Global Head, Big Data Analytics at Credit Suisse
Online Brokers
Webull Corporation (BULL)
eToro Group Ltd. (ETOR)
Unveils Alpha Portfolios: AI-powered investment strategies built on proprietary retail trading data
Offers 7 different strategies built using analysis of eToro’s proprietary retail trading data
Alpha Portfolios use advanced ML models to identify patterns and inefficiencies in eToro’s data pool in order to adapt strategies to generate alpha
Fear vs optimism? UK retail investors emerge as the world’s most hopeful
Robinhood Markets, Inc. (HOOD)
Interactive Brokers Group, Inc. (IBKR)
Chairman to Present at Piper Sandler Global Exchange and Trading Conference
Thursday, June 5, 9:30am ET
The Charles Schwab Corporation (SCHW)
25% plan to give more than last year while only 7% plan to give less
Company Specific Updates Anticipated for the Upcoming Week (Ended Jun. 6, 2025)
Exchanges
Cboe Global Markets, Inc. (CBOE)
May Monthly Volume Release and April RPCs
Anticipated Wednesday, June 4 post-close
CME Group Inc. (CME)
May Monthly Volume Release and April RPCs
Anticipated Tuesday, June 3 pre-market
Chairman and CEO to Present at Piper Sandler Global Exchange and Trading Conference
Thursday, June 5, 1:30pm ET
Intercontinental Exchange, Inc. (ICE)
May Monthly Volume Release and May RPCs
Anticipated Wednesday, June 4 pre-market
NYSE President to Present at Piper Sandler Global Exchange and Trading Conference
Thursday, June 5, 10:30am ET
Nasdaq, Inc. (NDAQ)
May Monthly Volume Release
Anticipated Tuesday, June 3 post-close
CEO to Present at Piper Sandler Global Exchange and Trading Conference
Thursday, June 5, 2:30pm ET
Fixed Income Trading Platforms
MarketAxess Holdings Inc. (MKTX)
May Monthly Volume Release
Anticipated Thursday, June 5 pre-market
Tradeweb Markets Inc. (TW)
May Monthly Volume Release
Anticipated Thursday, June 5 pre-market
CEO to Present at Piper Sandler Global Exchange and Trading Conference
Thursday, June 5, 11:30am ET
Online Brokers
Robinhood Markets, Inc. (HOOD)
Presents at Piper Sandler Global Exchange and Trading Conference
Thursday, June 5, 10:00am ET
Interactive Brokers Group, Inc. (IBKR)
May Monthly Metrics Release
Anticipated Monday, June 2 post-close
Chairman to Present at Piper Sandler Global Exchange and Trading Conference
Thursday, June 5, 9:30am ET
Next Four Weeks Calendar

Source: Company press releases and my estimates around timing
Major Macro Updates for Week Ended May 30, 2025
Durable Goods Orders (Apr.) – (6.3%) vs. consensus (7.8%) and prior 7.6%
Durable Goods Minus Transportation (Apr.) – 0.2% vs. prior (0.2%)
S&P CoreLogic Case Shiller Home Price Index (Mar.) – 4.1% vs. prior 4.5%
Consumer Confidence (May) – 98.0 vs. consensus 86.0 and prior 85.7
Initial jobless claims (week ended May 24) – 240k vs. consensus 230k and prior 226k
GDP First Revision (Q1) – (0.2%) vs. consensus (0.4%) and prior (0.3%)
Pending Home Sales (Apr.) – (6.3%) vs. consensus (1.0%) and prior 5.5%
Personal Income (Apr.) – 0.8% vs. consensus 0.3% and prior 0.7%
Consumer Spending (Apr.) – 0.2% vs. consensus 0.2% and prior 0.7%
PCE Index (Apr.) – 0.1% vs. consensus 0.1% and prior 0.0%
PCE Y/Y (Apr.) – 2.1% vs. consensus 2.2% and prior 2.3%
Core PCE Index (Apr.) – 0.1% vs. consensus 0.1% and prior 0.0%
Core PCE Y/Y (Apr.) – 2.5% vs. consensus 2.6% and prior 2.7%
Advanced U.S. Trade Balance in Goods (Apr.) – ($87.6B) vs. prior ($163.2B)
Advanced Retail Inventories (Apr.) – (0.1%) vs. prior (0.3%)
Advanced Wholesale Inventories (Apr.) – 0.0% vs. prior 0.3%
Chicago Business Barometer (May) – 40.5 vs. consensus 45.5 and prior 44.6
Final Consumer Sentiment (May) – 52.2 vs. consensus 50.8 and prior 50.8
Major Macro Updates Scheduled for the Upcoming Week (Ended Jun. 6, 2025)
Monday, Jun. 2
S&P Final U.S. Manufacturing PMI (May) – consensus 52.3 and prior 52.3
ISM Manufacturing (May) – consensus 48.5% and prior 48.7%
Construction Spending (Apr.) – consensus 0.2% and prior (0.5%)
Tuesday, Jun. 3
Factory Orders (Apr.) – consensus (3.2%) and prior 4.3%
Job Openings (Apr.) – prior 7.2M
Wednesday, Jun. 4
ADP Employment (May) – consensus 112k and prior 62k
S&P Final U.S. Services PMI (May) – prior 52.3%
ISM Services (May) – consensus 52.2% and prior 51.6%
Fed Beige Book Published
Thursday, Jun. 5
Initial jobless claims (week ended May 31) – prior 240k
U.S. Trade Deficit (Apr.) – consensus ($90.3B) and prior ($140.5B)
U.S. Productivity (1Q) – consensus (0.8%) and prior (0.8%)
Friday, Jun. 6
U.S. Employment Report (May) – consensus 125k and prior 177k
U.S. Unemployment Rate (May) – consensus 4.2% and prior 4.2%
U.S. Hourly Wages (May) – consensus 0.3% and prior 0.2%
Hourly Wages Y/Y (May) – prior 3.8%
Consumer Credit (Apr.) – consensus $10.2B and prior $10.2B
Exchange Volume Update
Exchange Volumes Over Past Week and W/W Trends
For the week ended May 30, 2025, volumes and volatility were mainly lower W/W as volatility cooled following a “delay” of new EU focused tariffs Trump tweeted about heading into Memorial Day weekend the prior week. This market has become absurd.
The average VIX for the week was down 5% from the prior week, average realized volatility increased 1% W/W, average volatility of volatility (as measured by the VVIX) was down 7% W/W and the average MOVE index (U.S. Treasuries volatility) was down 7% W/W.
Futures average daily volumes (ADV) were mixed as CBOE futures volumes were down 26% W/W, CME futures volumes were seasonally up 1% W/W, and ICE futures volumes were down 15% W/W.
Total U.S. Equities ADV was flat W/W, as TRF volumes increased 2% W/W while on-exchange volume fell 1% W/W. Industry equity options volumes were down 3% W/W while index options volumes fell 9% W/W.
For further detail on weekly volume trends by exchange and by product line please see the charts below.
CME Futures Volumes (M)
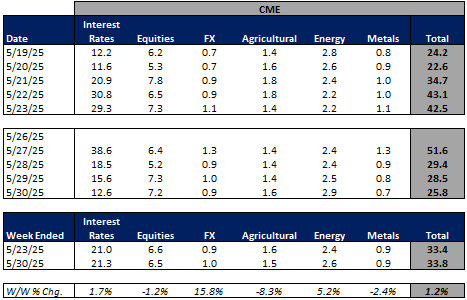
Source: Company Daily Volume Releases
ICE Futures (M), U.S. Equities (B) and U.S. Equity Options (M) Volumes
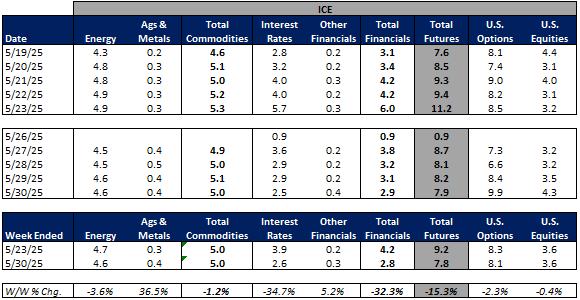
Source: Company Daily Volume Releases, Cboe Global Markets and OCC
CBOE Options (M), Futures (K), U.S. Equity (B), and FX Volumes ($B)

Source: Company Daily Volume Releases and OCC
NDAQ U.S. Equity (B) and Option (M) Volumes
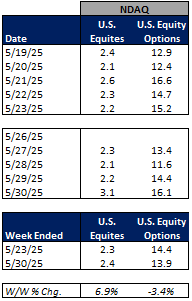
Source: Cboe Global Markets and OCC
U.S. Total Industry Equity Volumes (B)

Source: Cboe Global Markets
U.S. Total Industry Equity Option and Index Option Volumes (M)

Source: OCC
Volatility Metrics

Source: Yahoo Finance
Exchange Volumes MTD / QTD / YTD Trends
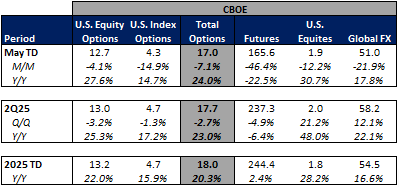
Exchange volumes are tracking lower in May-to-date relative to April but are generally higher Y/Y. This comes as volatility is up MTD on a Y/Y basis.
The average VIX in May-to-date is up 56% Y/Y while realized volatility is up 107% Y/Y and volatility of volatility is up 26% Y/Y. Treasuries volatility is higher as well Y/Y as the average MOVE index in May-to-date is up 7% Y/Y.
Futures volumes are mostly higher Y/Y as ICE futures MTD ADV is up 13% vs. May 2024 ADV. Meanwhile, CME ADV is up 10% Y/Y while CBOE futures ADV is down 23% Y/Y.
In terms of equities and options volumes, total U.S. equities ADV is up 41% MTD while option volumes are up 27% for equity options and up 15% for index options.
For further details on MTD / QTD and YTD ADV please see the charts below.
CME Futures Volumes (M)

Source: Company Daily Volume Releases
ICE Futures (M), U.S. Equities (B) and U.S. Equity Options (M) Volumes

Source: Company Daily Volume Releases, Cboe Global Markets and OCC
CBOE Options (M), Futures (K), U.S. Equity (B), and FX Volumes ($B)
Source: Company Daily Volume Releases and OCC
NDAQ U.S. Equity (B) and Option (M) Volumes

Source: Cboe Global Markets and OCC
U.S. Total Industry Equity Volumes (B)

Source: Cboe Global Markets
U.S. Total Industry Equity Option and Index Option Volumes (M)

Source: OCC
Volatility Metrics

Source: Yahoo Finance
Major Indices, Interest Rates and Company Share Price Trends
The market rose on the week (up 190 bps W/W) as treasury yields declined following a “delay” on Monday of threatened EU tariffs that came out Friday of the prior week. This market has become extremely annoying and I despise this TACO trade nonsense. But, we are operating under an extremely volatile regime so have to resort to just trading tweets … such is life.
In terms of the companies I follow, the fixed income trading companies both fell a little bit under 1% for the week. The eBrokers were mixed on limited news in the space, with BULL and ETOR falling 5% and 10%, respectively, SCHW and IBKR rising 1% and 2%, respectively, and HOOD up 5% on literally no news. And the exchanges were mainly higher with CME, ICE and NDAQ all up 2% on the week while CBOE fell 1%.
This week I took about half off my CBOE long position. The stock performed well through much of the tariff volatility noise from February into April but lately hasn’t been acting that great despite on again, off again tariff announcements. Further, volumes across CBOE’s proprietary products have been lagging the broader group (and in some cases are trending down Y/Y despite the volatility). As such I decided this was time to lower my position here. I still have about half of it on as I do continue to think volatility remains elevated for the foreseeable future and believe CBOE and CME are good places to hedge that.

Source: Yahoo Finance, FRED, U.S. Department of the Treasury
Comp Sheet

Source: Yahoo Finance
Guidance Tracker
Exchanges
Cboe Global Markets, Inc. (CBOE)
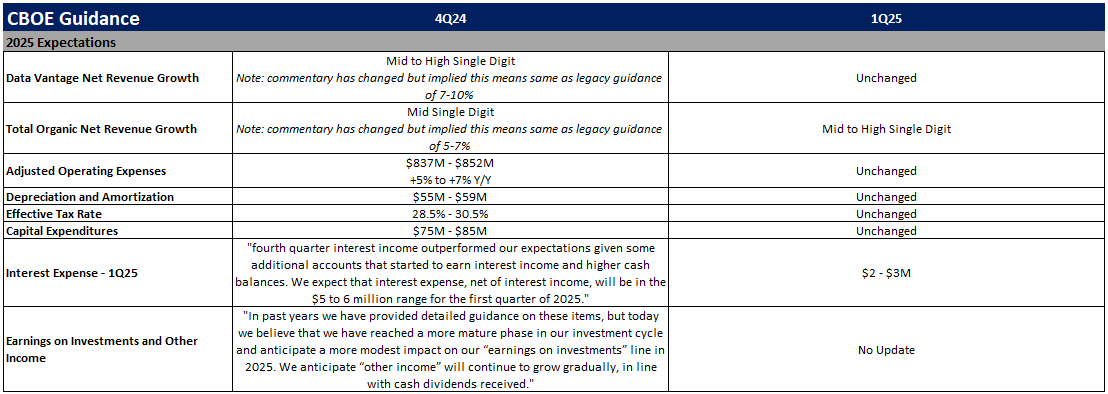
Source: Company documents
Note: CBOE provided additional guidance points / commentary on its 1Q25 earnings call, but key annual highlights are included above for the sake of simplicity
CME Group Inc. (CME)

Source: Company documents
Note: CME provided additional guidance points / commentary on its 1Q25 earnings call, but key annual highlights are included above for the sake of simplicity
Intercontinental Exchange, Inc. (ICE)

Source: Company documents
Note: ICE provided additional guidance points / commentary on its 1Q25 earnings call, but key annual highlights are included above for the sake of simplicity
Nasdaq, Inc. (NDAQ)

Source: Company documents
Note: NDAQ provided additional guidance points / commentary on its 1Q25 earnings call, but key annual highlights are included above for the sake of simplicity
Fixed Income Trading Platforms
MarketAxess Holdings Inc. (MKTX)

Source: Company documents
Note: MKTX provided additional guidance points / commentary on its 1Q25 earnings call, but key annual highlights are included above for the sake of simplicity
Tradeweb Markets Inc. (TW)

Source: Company documents
Note: TW provided additional guidance points / commentary on its 1Q25 earnings call, but key annual highlights are included above for the sake of simplicity
Online Brokers
Robinhood Markets, Inc. (HOOD)

Source: Company documents
Note: HOOD provided additional guidance points / commentary on its 1Q25 earnings call, but key annual highlights are included above for the sake of simplicity
Interactive Brokers Group, Inc. (IBKR)
Source: Company documents
Note: IBKR provided additional guidance points / commentary on its 1Q25 earnings call, but key annual highlights are included above for the sake of simplicity
The Charles Schwab Corporation (SCHW)
