


An Overview of The Retail Online Broker (eBroker) Industry
A High Level Primer on the eBroker Space (BULL, ETOR, HOOD, IBKR, SCHW) Including Thoughts On Recently Public eToro and Webull

What is a Retail Online Broker (eBroker)? And How Does Their Business Work?
At the very core, eBrokers offer a platform for retail investors to invest in various assets while also holding a bit of cash to be nimble in a dynamic market environment. Granted there are nuances to every model. For instance, Charles Schwab (SCHW 0.00%↑) caters to both individual investors and independent registered investment advisors (RIAs), Interactive Brokers (IBKR 0.00%↑) caters to individual investors, introducing brokers, financial advisors, prop trading groups and some hedge funds and mutual funds, while Robinhood (HOOD 0.00%↑), eToro (ETOR 0.00%↑) and Webull (BULL 0.00%↑) all cater more specifically to the self-directed retail investor. However, to reiterate, at the core eBrokers offer a platform for self-directed retail investors to buy and sell different assets.
The lifeblood of the eBroker business model is the total level of client assets (the more assets a client has the more firepower to trade in the markets and/or cash to earn interest income on). This figure is reported monthly by the three brokers who have been publicly traded longest (SCHW, IBKR, HOOD) and for the time being at least quarterly by ETOR and BULL. Total client assets are primarily determined by two main inputs: 1) net inflows / outflows of client assets (NNA) and 2) market related gains / losses. Net inflows / outflows of client assets are driven by client decision making, they can come from new clients to the firm opening an entirely new account with the company, they can come from existing clients transferring additional assets into their account with the firm, they can come from the decision to move assets out of the account with the firm, or from the decision to close an account entirely. On the other hand, market related gains / losses are driven by movement in the markets as asset values increase / decrease based on market forces which is largely not driven by client decision making.
Given market related gains / losses are largely outside the brokerage and its clients’ control, the key driver to watch for an individual brokers’ performance is net inflows / outflows of new assets. Another key growth driver to watch is total client accounts and / or net new client accounts as account growth typically leads to asset growth as clients (usually) continue to add assets to their account over time. One call-out here is SCHW and HOOD report net new assets (NNA) monthly, IBKR, ETOR and BULL do not (yet) report net new asset figures, however, if you estimate market gains / losses based on broad market indices during a given period you can come up with an estimate of NNA for the given broker.
When a client brings in a dollar of assets (cash) to the firm they essentially have two choices of what to do with that $1 of cash. They can 1) invest that $1 in one of many various asset classes (most typical in eBroker land will be equities, options/derivatives, more recently crypto) or 2) keep that $1 (or a portion of it) in cash to take advantage of market opportunities down the road. Clients typically elect to hold between 10% and 20% of total assets in cash to take advantage of any market dislocations with cash as a percentage of total assets usually increasing as markets fall and decreasing as markets rise.
I wanted to draw a diagram of what typically happens with a dollar of NNA but I’m a terrible artist and I figured I would let Stan and his banker discuss investing below (hopefully your eBroker doesn’t make your dollars go “poof”):

Source: GIPHY
Just remember, as a rule of thumb, between 80% and 90% of client assets are invested and between 10% and 20% remain as cash assets.
For the eBrokers, either decision the client makes is an opportunity to earn revenue. If the client elects to invest the $1 in an asset class, the broker earns transaction-based revenues on that decision. If the client elects to maintain that $1 in cash, the broker has an opportunity to earn interest income on that $1 by investing the cash itself (and paying interest to the client in order to utilize said dollar of cash).
From an investors’ perspective, transaction-based revenues are often viewed somewhat less favorably due to the volatile nature of the revenue stream (revenue can explode in volatile trading environments but totally dry up when markets are quiet or an asset class goes out of favor) while interest income is (generally) more recurring in nature (cash balances and interested rates don’t typically swing around wildly). That being said, transaction-based revenues have extremely high incremental margins as the additional cost of facilitating one extra trade for the brokerage is nearly $0.
A Brief History of the eBrokers

Charles Schwab (both the person and the company) helped pioneer the discount brokerage industry in 1975 after the SEC mandated negotiated commission rates for all securities transactions on May 1. Schwab took the route of offering discounted commission rates while other brokerages decided to increase rates following the mandate. Charles Schwab (the company, or some iteration thereof) had been in existence since 1971 at this point. Over time Charles Schwab continued to grow its brokerage operations and add additional products to its offering until it was eventually acquired by Bank of America in 1983 for $55M. In 1987 management bought back the company for $280M and subsequently took the company public on September 22 (almost exactly 1 month before Black Monday). In the subsequent years, SCHW continued to expand its business, both organically and via M&A, and eventually launched online trading in 1996.

Interactive Brokers was established in 1993 as a subsidiary of Timber Hill Inc., an electronic market maker formed in 1982 by Thomas Peterffy. Interactive Brokers offered a brokerage platform catering to a wide variety of investors ranging from individuals to introducing brokers to prop traders to hedge funds. Together, with its market maker parent, the company continued to grow and expand both geographically and in its product offerings. In 2007, Interactive Brokers Group went public under the ticker IBKR. In 2016 the company eventually decided to phase out the market making business and solely focus on its brokerage business.

Around the time of IBKR’s IPO, eToro was founded as a social investing platform designed around the idea of a collaborative investment community accessible to anyone. In eToro’s initial stages it launched as an FX trading platform, eventually adding commodities and then equities by 2013 and cryptocurrencies by 2017. In 2010, the company launched its CopyTrader feature which allows anyone to copy the trades of other successful traders within eToro’s ecosystem. In 2019 eToro entered the U.S. market via its crypto platform followed by stock trading in the U.S. in 2022.

In 2013, Robinhood launched with the aim of democratizing finance for all. The company started with the idea that everyone, regardless of background or financial situation, should be able to access and invest in the financial markets and that the cost of trading should not be a barrier to entry for financial services. Under that basis, the company began offering equity trading commission free to clients with no account minimums. As the rest of the eBrokerage industry watched Robinhood rapidly acquire accounts, SCHW eventually reduced commission fees to $0 on all equity, ETF and options trades in 2019, which was immediately (meaning the very same day and/or very next day) followed by IBKR, TD Ameritrade (subsequently acquired by SCHW) and E*Trade (subsequently acquired by Morgan Stanley) all reducing commissions to $0. Over the years since its launch, Robinhood has drastically expanded its offerings, including adding additional asset classes (crypto, options, most recently futures), becoming the first broker to offer 24-hour trading in individual stocks (also subsequently copied by the other eBrokers), adding various banking products, retirement accounts, expanding into the U.K. (equity trading) and E.U. (crypto trading) and even launching a credit card. The company went public in July 2021 and anticipates continuing to grow its business via geographic expansion and a continuation of new product / asset class launches with the goal of becoming the global financial ecosystem of the future.

Finally, in 2016, Webull launched as a mobile app providing free market information to users. In 2018 the company began offering brokerage services to users in the U.S. despite the initial entity being incorporated in China. The reason BULL chose the U.S. for its initial brokerage offering was due to the massive market opportunity and large quantity of retail investors located within the United States. The company primarily offers equity and options trading, still mainly to clients within the United States, though has more recently expanded into Hong Kong, Singapore and a handful of other countries. The company plans to continue its global expansion as it has obtained a number of broker-dealer licenses including in Canada, Indonesia, Malaysia, Thailand, Australia, the U.K., South Africa, the Netherlands and is in the process of obtaining licenses in Latin America.
Recent Key Metrics and Growth Results
Looking at some of the KPIs for eBrokerage group, we see quite the dispersion of results. While we are sitting here in mid-May and HOOD, IBKR, and SCHW have all reported 1Q25 earnings results, the focus of this analysis will be on the full year 2022, 2023, and 2024 results as BULL and ETOR have yet to report 1Q25 activity (ETOR has provided preliminary figures across a handful of metrics). For an overview of HOOD, IBKR and SCHW 1Q25 metrics, see my post from a couple weeks ago here or see each individual broker’s earnings recap note available at the following links: HOOD, IBKR and SCHW.
In terms of client assets, 2024 was highlighted by strong market-related gains, providing a tailwind to asset growth for the year. By broker, HOOD showed the strongest increase in client assets vs. 2023 year-end levels, increasing client assets by 88% to $193B. This was followed by ETOR posting a 73% increase in client assets to $16.6B, BULL posting a 66% increase to $13.6B, then IBKR posting a 33% increase to $568B. At the tail end was SCHW which posted a 19% increase in client assets, ending 2024 at $10.1T. Of course, its unbelievable putting SCHW in these comps as SCHW ended 2024 at nearly 13 times the size of the other 4 eBrokers combined.
eBroker Year End Client Assets

Source: company documents
On the client account front we see a similar, though less dramatic, dispersion of results across the group. In 2024, client account growth was led by IBKR which produced 30% Y/Y growth in accounts to 3.3M. This was followed by ETOR with 15% Y/Y growth to 3.5M accounts, BULL with 9% Y/Y growth to 4.7M accounts then HOOD with 8% Y/Y growth to 25.2M accounts. Once again, bringing up the rear was SCHW with 5% account growth to 43.9M.
eBroker Year End Client Accounts

Source: company documents
Given we have total client asset and total client account figures, we can begin to paint a picture of average account size across the group. BULL, ETOR, and HOOD certainly seem to cater to clients with smaller average account sizes as the companies show average assets per account ranging from $3k to $7k as of the end of 2024 vs. IBKR and SCHW which show average account balances of $170k and $230k, respectively. The dramatic difference certainly reflects client mix given IBKR counts introducing brokers, prop traders and hedge/mutual funds amongst its client base while SCHW targets affluent self-directed investors and RIAs. However, it does appear that HOOD has begun shifting focus towards larger account sizes (more affluent customers) as its average assets per account increased 75% from the end of 2023 to the end of 2024, far outpacing the net market gains put up in the year. Meanwhile, it appears that IBKR could be attracting smaller account sizes given average assets per account increased 2% Y/Y, far lower than what would have been implied purely from market related gains in the year.
eBroker Year End Avg. Client Assets per Account

Source: company documents
Finally, taking a brief look at revenues before diving in further below, 2024 total net revenue ranged from flat Y/Y at BULL to +58% Y/Y at HOOD. The dispersion in revenue can largely be attributed to mix as those companies more leveraged towards trading (generally) saw a big spike in activity in 2024.
eBroker Full Year Net Revenues

Source: company documents
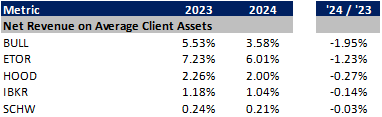
In terms of revenue on client assets, ETOR has generated the highest yield on its asset base with revenue on average client assets of 6.01% in 2024, followed by BULL at 3.58%, HOOD at 2.00%, IBKR at 1.04% and SCHW at 0.21%. While SCHW and IBKR are well below the levels of ETOR, BULL and HOOD, this is largely due to the drastically larger asset base and more recurring revenue streams at IBKR and SCHW relative to the newer entrants to the space.
eBroker Revenue on Average Client Assets (ROCA)
Source: company documents
eBroker Revenue Composition – Mix Ranges from Heavily Trading Focused to More NII Focused
In terms of revenue mix, the newer entrants to the space tend to rely more heavily on transaction-based revenues as opposed to net interest income or other revenue. HOOD, ETOR and BULL all posted transaction revenue of about 60% of total net revenue in 2024. Meanwhile, net interest revenue made up 20-30% of the pie with other comprising the small remainder. At IBKR, transaction revenue amounted to about half that of the newer entrants to the space while net interest revenue comprised 60% of the mix. Finally, at SCHW, transaction revenue made up less than 20% of the total, while net interest revenue made up 50% and other revenue comprised 33% of the mix. For SCHW, a large portion of other revenue relates to asset management and administration fees which are generated from fees charged on SCHW’s proprietary money market funds, equity funds, mutual funds, etc. These revenue streams are largely very stable and recurring in nature and should continue to grow so long as asset levels continue to increase (and fee rates don’t evaporate).

Source: company documents; based on full year 2024 results
Notes: Despite BULL’s revenue mix, revenue was flat Y/Y in 2024 as BULL rolled out its cash sweep offering in April 2023 which weighed on NII in 2024 (lower interest rate on cash sweep vs. segregated cash), offsetting the uplift from higher transaction-based revenues. SCHW net interest revenue includes BDA fees.
Even within the specific line items, there is a large disparity between the five brokers. The primary difference we can see is ETOR and HOOD are really the only two with a focus on crypto for the time being (yes, IBKR and SCHW offer crypto trading but neither report out disaggregated revenue yet). This focus on crypto transaction-based revenue drove the strong revenue outperformance in 2024 for HOOD and ETOR as crypto transaction revenues were up 360% and 245% Y/Y, respectively.

Source: company documents; based on full year 2024 results
Notes: ETOR does not disaggregate between equities, commodities, currencies – it is likely the equities bar should be split similar to the 60/40ish derivatives vs. equities seen at SCHW and IBKR.
Before we move off of transaction-based revenues, you may be asking yourself, well how do the eBrokers generate revenue from equities and derivatives trading when you told me in the history section they all reduced commissions to $0 in 2019 because of the threat Robinhood was posing. The answer to that is Payments for Order Flow (PFOF). I do not want to get into a broad discussion around PFOF in this article (maybe if I get around to writing a regulatory piece we will touch on it) but the gist of it is: PFOF is a “controversial” practice in which the brokers send customer orders to various market makers, who in turn pay the broker for sending that order flow their way. The practice is controversial in that there could be a conflict of interest in whom the broker decides to route orders to, however, typically brokerage customers receive price improvement from the market makers, so the practice does ultimately benefit brokerage clients.
Similarly, within interest income we see a fairly varied mix of revenue composition. IBKR and ETOR are both heavily reliant on margin lending and interest on segregated cash. Meanwhile, cash sweep is a much larger part of the mix at BULL, HOOD and SCHW. Other interest income is also much larger for BULL and HOOD, which relates to interest earned on corporate cash and fully paid stock lending. Finally, HOOD and SCHW also offer other lending products, which include HOOD’s credit card offering and SCHW’s bank loans (primarily mortgages).

Source: company documents; based on full year 2024 results
Notes: BULL mix assumes 50% of segregated cash is segregated cash and 50% is related to its cash sweep product. SCHW cash sweep includes AFS and HTM securities income and BDA fees. Other revenue generally includes income from corporate cash investments and fully paid stock lending revenue.
Geographic Mix – Two of Five Primarily Focused Outside U.S. … For Now
In terms of geographic reach, BULL, ETOR, and IBKR provide detailed breakouts of account, asset, or revenue mix while HOOD and SCHW do not disaggregate. However, given there are no disclosures from HOOD and SCHW, it is likely that revenue generated outside the U.S. is less than 10% and potentially similar in terms of non-U.S. mix to that of BULL, which generates 95% of revenue within the U.S. Note that a big part of HOOD’s growth strategy is geographic expansion, as exemplified by its acquisition of WonderFi (located in Canada) announced on May 13, so we could see disclosures in the coming years as they continue to grow internationally.

Source: BULL F1
For ETOR, the bulk of its account base is located in Europe and the U.K. (70%) followed by about 15% in the Asia Pacific region, 10% in the Americas and the remainder in Middle East and Africa.

Source: ETOR F1
At IBKR, about 40% of its accounts are based in the Asia-Pacific region, 30% are based in Europe and 30% are based in the Americas.

Source: IBKR 4Q24 presentation
Operating Margins & Headcount Efficiency
The eBrokers tend to be efficient businesses (other than when they are investing aggressively to support growth as we see from BULL, ETOR and HOOD in recent years). IBKR and SCHW both posted operating margins north of 40%, with IBKR north of 70%. And in 2024, given the strong trading revenue results, ETOR and HOOD both posted operating margins north of 30%, while BULL posted an operating loss of 4% for the year.
eBroker Revenue, Operating Expenses and Operating Margins

Source: company documents
One of the key drivers of the eBrokers’ ability to be so efficient is that it does not require a massive headcount investment to support incremental assets on the platform, once the brokers are at scale.
As you can see below, each employee at SCHW is able to support $315M in client assets (as of the end of 2024). This compares to $190M at IBKR, $84M at HOOD and about $11M at BULL and ETOR. On the revenue side, revenue generated per employee is highest at IBKR at $1.7M per FTE followed by HOOD at $1.3M, $611k at SCHW, $524k at ETOR and $327k at BULL. The difference between SCHW employees supporting the highest amount of client assets and IBKR generating the highest revenue per employee relates to the relative revenue mix given SCHW’s skew towards lower yielding asset management fees and net interest income and IBKR’s higher mix of transaction-based revenues.
eBroker Headcount, Assets Per Employee and Revenue per Employee

Source: company documents
Current Valuation of the Group and Thoughts
While I don’t love looking at valuation based on LTM anything, much less on LTM revenue, given BULL and ETOR do not have any consensus forward estimates and given BULL posted an operating loss in 2024, for the purposes of looking at the whole group, I will reluctantly reference valuation based on LTM revenues.
eBrokerage Valuation Metrics

Source: company documents and tikr.com
Of the three that have been public the longest, HOOD and IBKR are trading at a premium at around 16-17x LTM revenue. I think a premium to SCHW is certainly warranted given the substantially higher growth profile of client assets at HOOD and IBKR. When bringing into the fold BULL and ETOR, we see that BULL is trading at about 15x LTM revenue vs. ETOR at 7x (below SCHW). It seems a bit head scratchy to me that ETOR would be trading at such a discount to BULL and HOOD. The only thing that really makes sense when comparing ETOR to BULL is if you think crypto transaction revenue is not going to be sustained at 2024 levels, which is an absolutely valid assumption. However, if you are going to make that case, you need to be making the same argument with respect to HOOD revenue, which doesn’t seem to be reflected here. What I’m getting at here is there could be an opportunity to go long ETOR vs. short BULL and HOOD (though I am absolutely too terrified to touch any of these three in either direction – and this is not and never will be investment advice).
In thinking about HOOD / IBKR / SCHW, yes, HOOD and IBKR deserve to trade at a premium to SCHW given growth profiles. However, SCHW is set to grow EPS at the same rate as HOOD over the next 2 years (assuming consensus EPS is correct) and at a massively faster clip than IBKR is expected to, given the dynamics on SCHW’s balance sheet. Meanwhile, IBKR and HOOD are both trading near their highs on a P/E basis vs. SCHW, which is just above its average over the past 3 years. To me it feels like there could be an opportunity to go long SCHW vs. short IBKR / HOOD. I’ve been long SCHW for a while now but have no position in either IBKR or HOOD (as mentioned above way too scared to touch HOOD right now). Again, this is not investment advice, just pointing out some things I’m seeing.