
Weekly Recap for Week Ended June 6, 2025
Weekly Recap of Major Micro / Macro Data Points and Things to Look Forward to in the Week Ahead

Significant News / Developments from Week Ended Jun. 6, 2025
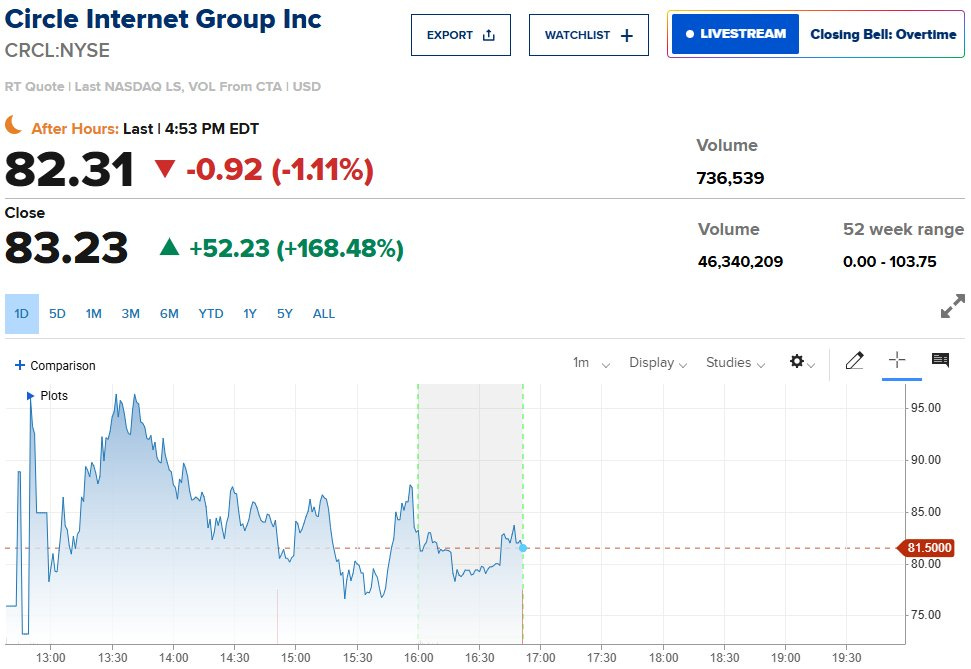
Circle Internet Group, Inc. (CRCL) IPO
This past week stablecoin issuer CRCL 0.00%↑ priced its IPO at $31 (above the high end of the initial range), valuing the company at $6.8B. Shares began trading on NYSE on Thursday, June 5 and popped an unbelievable 168% in their first day of trading. This was followed by a 29% rally on Friday bringing the market cap by the end of the week to nearly $24B.
Source: CNBC.com
I have only really just begun digging into CRCL’s S-1 so will have to refrain from commenting about prospective earnings or valuation (I meant to get more done ahead of this week but I do have a day job as well as general life obligations that kept me from allocating more time here). That being said, stablecoins have proven to rapidly increase payment and settlement times, especially with cross border transactions and I believe there is a real use case here to increase velocity of cash and free up capital that currently awaits settlement. I will continue to dig in on CRCL and plan to add it to my coverage list in the coming weeks as I believe it fits nicely within the ecosystem.
One thing I did want to share from CRCL S-1 that I personally found funny / ballsy to put into print is the below snippet suggesting that CRCL’s TAM is quite literally the largest TAM on the planet …

Source: CRCL S-1
S&P 500 Constituent Base Unchanged
According to Bloomberg, after the close on Friday, S&P Dow Jones announced that it was making no updates to the S&P 500 at its next rebalance towards the end of June. This was unfortunate news for those playing Robinhood this past week for potential inclusion. Based on what I have seen the stock was down about 5% in after hours trading on Friday. As I have been saying over the past couple weeks, even after the post-close sell-off, I continue to believe the premium HOOD is trading at to peers is kind of crazy and anticipate that we could see shares come under additional pressure in the coming days as the next rebalance announcement likely won’t come until September.
Programming Update
Given seven out of the eleven companies I regularly discuss reported monthly metrics this past week I wanted to provide an update on cadence of my write-ups as I’m thinking about things for now.
I track daily volumes across the exchange group and have been putting out a write-up on exchange volumes the morning of the first business day of the month for a few months now (latest available here). Given this monthly write-up I have decided to forgo writing up individual exchange monthly details as the companies release them because it feels a little redundant to put out another post on each individual exchange. That said, there is usually additional detail within the monthly releases (primarily RPC data and some volumes I’m unable to track daily). As such, I have been posting small thought blurbs on each individual exchange to my twitter (here) as well as to my notes on Substack. These thought blurbs will be included in my weekly recap posts as can be seen below.
For online brokers IBKR 0.00%↑ is the only company to have reported May results so far. Last month I wrote a recap piece on the whole group after SCHW 0.00%↑ and HOOD 0.00%↑ released results (expected next week for May data). Similar to the exchanges above, I think I am going to keep updating thoughts on eBrokers in one consolidated monthly update but will also provide thought blurbs to twitter / Substack notes (as can be seen with IBKR below).
For fixed income trading companies I am thinking similarly to the online brokers. Last week I wrote my first consolidated recap for the two (MKTX 0.00%↑ and TW 0.00%↑) which is available here.
If anyone has thoughts / comments / questions / concerns on this proposed cadence please feel free to let me know!
Company Specific Updates for Week Ended Jun. 6, 2025
Exchanges
Cboe Global Markets, Inc. (CBOE 0.00%↑)
Reports May volume and April RPCs
Similar to the other exchanges most volumes were known ahead of the release due to daily volume tracking (here) but RPCs were the new detail in todays release
RPCs came in mixed with options (both equity and index), Canada equities and Australia equities up M/M while all other products (futures, U.S. equities, E.U. equities, Japan equities, FX, and clearing) declined M/M
Based on this release my estimates aren’t changing

Source: company documents
CME Group Inc. (CME 0.00%↑)
Announces Record Volume, Open Interest Across Battery Metals Complex
2,587 contracts traded across battery metals futures and options on May 29
Surpassed prior record of 2,301 traded on February 11
OI reached all time high of 64,387 contracts
Farmer sentiment reaches a four-year high in May
The Purdue University/CME Group Ag Economy Barometer rose 10 points 158, up from 148 in April
Both the Index of Current Conditions and the Index of Future Expectations contributed to the increase, with the current conditions index up 5 points to 146 and the future expectations index jumping 12 points to 164
Announces May Volumes and April RPCs
Futures & Options volumes were largely known heading into the release as mentioned in my exchange volume update piece from last Monday (here)
The release did include RPC detail for April (new info) which showed RPC down 2.4% M/M (-4.2% Y/Y)
The M/M decline should have been expected given strong volumes for the trailing 3-month period
Other new information in the release included Cash Markets ADV for May and Cash Markets trailing 3-month revenue for April
Largely, the release was inline with my expectations as I had marked my model for the strong volume environment after the 1Q EPS release and had assumed RPC for April would fall given volumes
Not seeing a need to materially move EPS estimates on this release

Source: Company documents
Intercontinental Exchange, Inc. (ICE 0.00%↑)
Launches its first Futures Contracts Based on Battery Materials
New contracts cover lithium hydroxide, lithium carbonate, cobalt and spodumene and are based on Fastmarkets’ price assessments
U.S. mortgage holders carried a record $17.6 trillion in home equity entering the second quarter of 2025, with $11.5 trillion considered tappable
First-quarter second lien equity withdrawals rose 22% year over year to nearly $25 billion — the largest first quarter volume in 17 years
STOXX and ICE collaborate on New Suite of Fixed Income Indices
On June 2 the companies launched a suite of fixed income climate indices for which ICE provides pricing, reference data and index calculations
The companies are also already collaborating on STOXX’s eb.rexx bond indices which tracks the market for German government fixed income securities denominated in Euros
The volume picture was largely known coming into release due to daily volume tracking (commentary from early last week here) but RPCs were new info today
Total Futures RPC was down 2% M/M (-10% Y/Y) primarily on mix with lower priced financials contracts making up a larger part of the volume mix for the trailing three months ended May
Options RPC was flat M/M (+40% Y/Y - seeing this Y/Y increase reflected in steep market share losses Y/Y)
Equities RPC -7% M/M (-17% Y/Y)
Not seeing a need to tweak EPS meaningfully on this data today

Source: Company documents
Nasdaq, Inc. (NDAQ 0.00%↑)
Releases Monthly Volumes for May
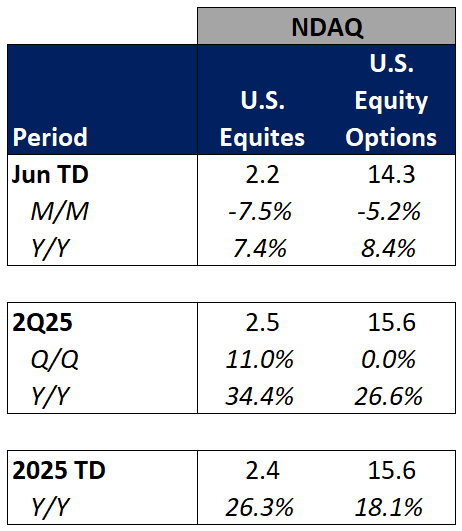
I previewed much of this in my exchange volume at the beginning of last week (here) but ADV was up double digits across the board Y/Y, though fell M/M as volatility subsided vs. elevated April levels
Not seeing much need to change numbers on this given I marked my model for strong QTD volumes following the 1Q25 earnings release

Source: Company documents
Fixed Income Trading Platforms
MarketAxess Holdings Inc. (MKTX)
CFO to Participate in the Morgan Stanley U.S. Financials Conference
Tuesday, June 10, 2025 4:00pm ET
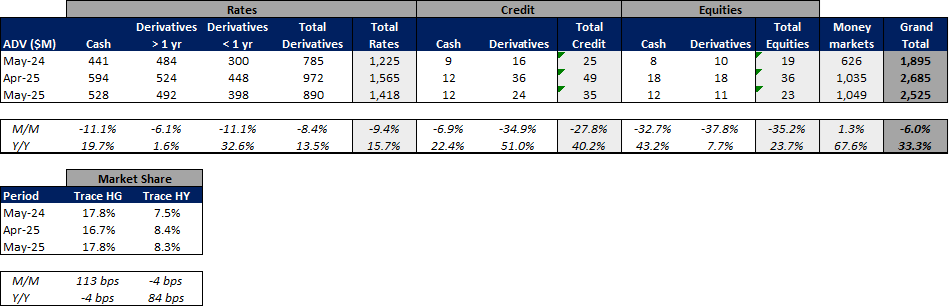
ADV declined 20% M/M but increased 44% Y/Y to $46.2B
Total credit ADV of $16.3B, which was down 11% M/M but up 22% Y/Y
Total rates ADV for the month came in at $29.9B (-24% M/M, +59% Y/Y)
MKTX picked up 4bps of market share in USHG trading for the month (+66bps Y/Y), finishing May with market share of 19.3%
Within USHY, MKTX reported market share of 12.2% (-135bps M/M, -64bps Y/Y)
Full recap note of TW and MKTX volumes available here

Source: company documents
Tradeweb Markets Inc. (TW)
ADV declined 6% M/M but increased 33% Y/Y to $2.5T
Total rates ADV of $1.4T (-9% M/M, +16% Y/Y)
Total credit ADV for the month was $35B (-28% M/M, +40% Y/Y)
Equities ADV ended the month at $23B (-35% M/M, +24% Y/Y)
Money markets ADV finished May at $1.0T (+1% M/M, +68% Y/Y)
Full recap note of TW and MKTX volumes available here
Source: company documents
Online Brokers
eToro Group Ltd. (ETOR)
Robinhood Markets, Inc. (HOOD)
Closes Acquisition of Bitstamp
Acquisition closed on June 2
Total consideration unchanged at $200M
As of April 30, 2025 Bitstamp served 500k retail customers and 5k institutional customers and most of Bitstamp exchange volume was institutional
HOOD anticipates $65M in Bitstamp related costs during remaining 7 months of 2025
Bitstamp did $95M in revenue for the 12 months ended April 30, 2025
Robinhood anticipates Bitstamp to be neutral to adj. EBITDA immediately following the acquisition and accretive within 12 months post-close
Released preliminary May metrics
Preliminary results seem mainly positive
Trading volume was up sequentially across the board with particular strength in crypto trading
Margin balances ended the month at an all-time high
Only “negative” I could point to is NNA slowed to an 18% annualized growth rate from 30%+ level YTD as promotional activity rolled off
Announces Date for Full May Metrics Release
June 11 pre-market
Interactive Brokers Group, Inc. (IBKR)
Reports Monthly Metrics for May
Accounts +32% Y/Y
DARTs +43% Y/Y (-11% M/M given volatility/broad volume coming off highs)
Client Equity +29% Y/Y - est. NNA +34% annualized
Margin Balances +5% M/M - still 6% off Jan. highs

Source: company documents
The Charles Schwab Corporation (SCHW)
Company Specific Updates Anticipated for the Upcoming Week (Ended Jun. 13, 2025)
Exchanges
Nasdaq, Inc. (NDAQ)
President Presents at Morgan Stanley Conference
Tuesday, June 10 9:45am ET
Fixed Income Trading Platforms
MarketAxess Holdings Inc. (MKTX)
CFO Presents at Morgan Stanley Conference
Tuesday, June 10 4:00pm ET
Online Brokers
Robinhood Markets, Inc. (HOOD)
May Monthly Metrics Report
Anticipated Thursday, June 11 pre-market
The Charles Schwab Corporation (SCHW)
May Monthly Metrics Report
Anticipated Friday, June 13 pre-market
Next Four Weeks Calendar

Source: Company press releases and my estimates around timing
Major Macro Updates for Week Ended Jun. 6, 2025
S&P Final U.S. Manufacturing PMI (May) – 52.0 vs. consensus 52.3 and prior 52.3
ISM Manufacturing (May) – 48.5 vs. consensus 48.5 and prior 48.7
Construction Spending (Apr.) – (0.4%) vs. consensus 0.2% and prior (0.8%)
Factory Orders (Apr.) – (3.7%) vs. consensus (3.3%) and prior 3.4%
Job Openings (Apr.) – 7.4M vs. consensus 7.1M and prior 7.2M
Auto Sales (May) – 15.65M vs. prior 17.3M
ADP Employment (May) – 37k vs. consensus 110k and prior 60k
S&P Final U.S. Services PMI (May) – 53.7 vs. consensus 52.3 and prior 52.3
ISM Services (May) – 49.9% vs. consensus 52.1% and prior 51.6%
Initial jobless claims (week ended May 31) – 247k vs. consensus 236k and prior 239k
U.S. Trade Deficit (Apr.) – $61.6B vs. consensus $63.3B and prior $140.5B
U.S. Productivity (1Q) – (1.5%) vs. consensus (0.8%) and prior (0.8%)
U.S. Employment Report (May) – 139k vs. consensus 125k and prior 147k
U.S. Unemployment Rate (May) – 4.2% vs. consensus 4.2% and prior 4.2%
U.S. Hourly Wages (May) – 0.4% vs. consensus 0.3% and prior 0.2%
Hourly Wages Y/Y (May) – 3.9% vs. consensus 3.7% and prior 3.8%
Major Macro Updates Scheduled for the Upcoming Week (Ended Jun. 13, 2025)
Monday, Jun. 9
Wholesale Inventories (Apr.) – consensus 0.0% and prior 0.4%
Tuesday, Jun. 10
NFIB Optimism Index (May) – consensus 96.0 and prior 95.8
Wednesday, Jun. 11
Consumer Price Index (May) – consensus 0.2% and prior 0.2%
Consumer Price Index Y/Y (May) – consensus 2.5% and prior 2.3%
Core CPI (May) – consensus 0.3% and prior 0.2%
Core CPI Y/Y (May) – consensus 2.9% and prior 2.8%
Monthly U.S. Federal Budget (May) – consensus $318B and prior $347B
Thursday, Jun. 12
Initial jobless claims (week ended Jun. 7) – consensus 252k and prior 247k
Producer Price Index (May) – consensus 0.2% and prior (0.5%)
Core PPI (May) – prior (0.1%)
PPI Y/Y (May) – prior 2.4%
Core PPI Y/Y (May) – prior 2.9%
Friday, Jun. 13
Preliminary Consumer Sentiment (Jun.) – consensus 55.0 and prior 52.2
Exchange Volume Update
Exchange Volumes Over Past Week and W/W Trends
For the week ended June 6, 2025, volumes were mixed while volatility metrics were mainly lower W/W.
The average VIX for the week was down 6% from the prior week, average realized volatility fell 5% W/W, average volatility of volatility (as measured by the VVIX) was down 5% W/W and the average MOVE index (U.S. Treasuries volatility) was up 2% W/W.
Futures average daily volumes (ADV) were mixed as CBOE futures volumes were up 7% W/W, CME futures volumes were down 30% W/W, and ICE futures volumes were up 14% W/W.
Total U.S. Equities ADV was down 11%W/W, as TRF volumes fell 9% W/W while on-exchange volume fell 13% W/W. Industry equity options volumes were up 2% W/W while index options volumes rose 1% W/W.
For further detail on weekly volume trends by exchange and by product line please see the charts below.
CME Futures Volumes (M)
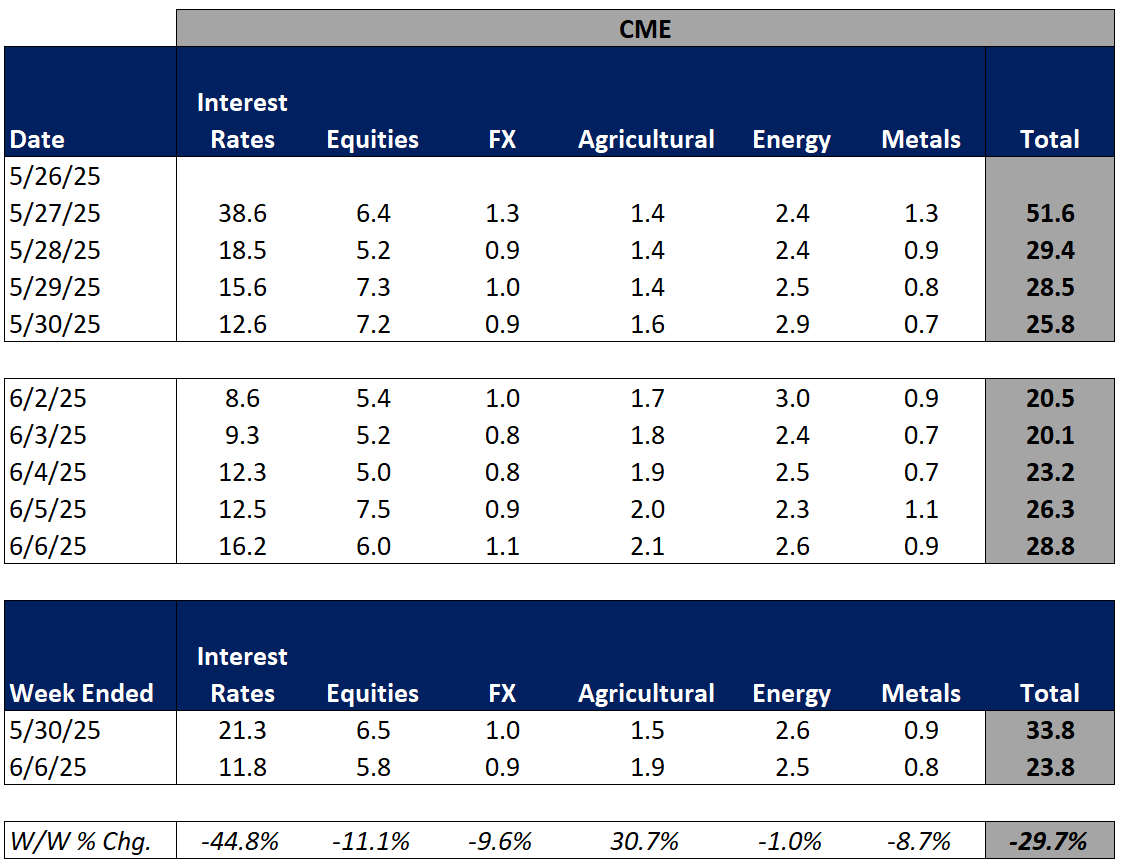
Source: Company Daily Volume Releases
ICE Futures (M), U.S. Equities (B) and U.S. Equity Options (M) Volumes

Source: Company Daily Volume Releases, Cboe Global Markets and OCC
CBOE Options (M), Futures (K), U.S. Equity (B), and FX Volumes ($B)

Source: Company Daily Volume Releases and OCC
NDAQ U.S. Equity (B) and Option (M) Volumes

Source: Cboe Global Markets and OCC
U.S. Total Industry Equity Volumes (B)

Source: Cboe Global Markets
U.S. Total Industry Equity Option and Index Option Volumes (M)

Source: OCC
Volatility Metrics

Source: Yahoo Finance
Exchange Volumes MTD / QTD / YTD Trends
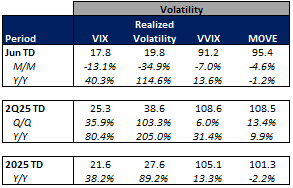
Exchange volumes are tracking mainly lower in June-to-date relative to May and are mixed Y/Y. This comes as volatility is up MTD on a Y/Y basis.
The average VIX in June-to-date is up 40% Y/Y while realized volatility is up 115% Y/Y and volatility of volatility is up 14% Y/Y. Treasuries volatility is lower Y/Y as the average MOVE index in June-to-date is down 1% Y/Y.
Futures volumes are mixed Y/Y as ICE futures MTD ADV is up 4% vs. May 2024 ADV. Meanwhile, CME ADV is down 6% Y/Y while CBOE futures ADV is down 37% Y/Y.
In terms of equities and options volumes, total U.S. equities ADV is up 35% MTD while option volumes are up 10% for equity options and up 4% for index options.
For further details on MTD / QTD and YTD ADV please see the charts below.
CME Futures Volumes (M)

Source: Company Daily Volume Releases
ICE Futures (M), U.S. Equities (B) and U.S. Equity Options (M) Volumes

Source: Company Daily Volume Releases, Cboe Global Markets and OCC
CBOE Options (M), Futures (K), U.S. Equity (B), and FX Volumes ($B)

Source: Company Daily Volume Releases and OCC
NDAQ U.S. Equity (B) and Option (M) Volumes
Source: Cboe Global Markets and OCC
U.S. Total Industry Equity Volumes (B)

Source: Cboe Global Markets
U.S. Total Industry Equity Option and Index Option Volumes (M)

Source: OCC
Volatility Metrics
Source: Yahoo Finance
Major Indices, Interest Rates and Company Share Price Trends
The market rose on the week (up 150 bps W/W) while treasury yields increased 10-15bps W/W. The biggest news on the week was the Trump/Musk fallout on Thursday but in terms of market moving news, the positive jobs report on Friday provided some relief, sending the market up 1% for the day, driving most of the week’s gains.
In terms of the companies I follow, the online brokers remain a wild space to watch with HOOD and ETOR rising 13% and 16% on the week on no fundamental news but continued hopes of HOOD addition to the S&P 500. In the remainder of eBroker land, BULL fell 6% on the week while IBKR was up 1% after a fairly positive monthly update and SCHW was flat. The exchanges were mixed with CBOE and CME falling 3% and 5%, respectively as volumes continue to cool while ICE was down less than 1% and NDAQ was up less than 3%. MKTX rose 3% on the week while TW fell 3% as market share seems to have shifted in MKTX’s favor within USHG trading as was recapped in my monthly note out Thursday evening.
Following up on some of the moves I made last week, I also lowered my CME position by about half as the volume picture has cooled, though I continue to maintain a position here as I continue to think we are living in a more volatile environment for the time being.

Source: Yahoo Finance, FRED, U.S. Department of the Treasury
Comp Sheet

Source: Yahoo Finance
Guidance Tracker
Exchanges
Cboe Global Markets, Inc. (CBOE)
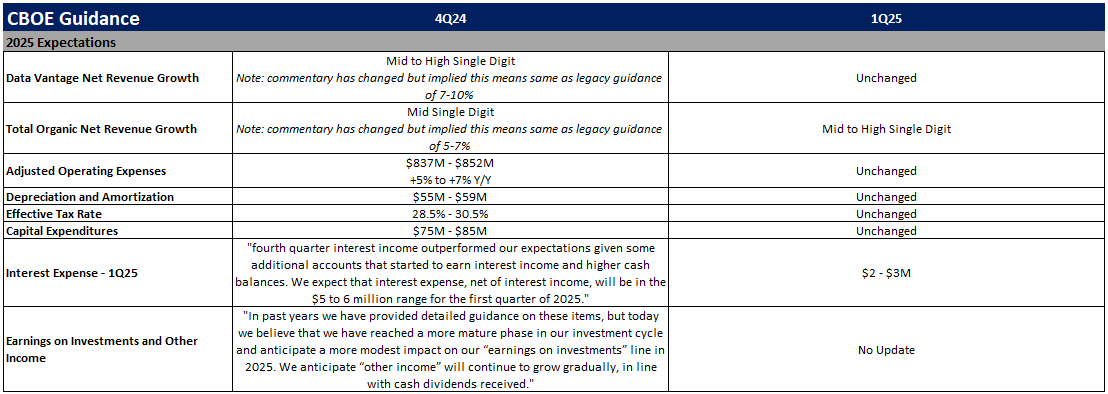
Source: Company documents
Note: CBOE provided additional guidance points / commentary on its 1Q25 earnings call, but key annual highlights are included above for the sake of simplicity
CME Group Inc. (CME)

Source: Company documents
Note: CME provided additional guidance points / commentary on its 1Q25 earnings call, but key annual highlights are included above for the sake of simplicity
Intercontinental Exchange, Inc. (ICE)

Source: Company documents
Note: ICE provided additional guidance points / commentary on its 1Q25 earnings call, but key annual highlights are included above for the sake of simplicity
Nasdaq, Inc. (NDAQ)

Source: Company documents
Note: NDAQ provided additional guidance points / commentary on its 1Q25 earnings call, but key annual highlights are included above for the sake of simplicity
Fixed Income Trading Platforms
MarketAxess Holdings Inc. (MKTX)

Source: Company documents
Note: MKTX provided additional guidance points / commentary on its 1Q25 earnings call, but key annual highlights are included above for the sake of simplicity
Tradeweb Markets Inc. (TW)

Source: Company documents
Note: TW provided additional guidance points / commentary on its 1Q25 earnings call, but key annual highlights are included above for the sake of simplicity
Online Brokers
Robinhood Markets, Inc. (HOOD)

Source: Company documents
Note: HOOD provided additional guidance points / commentary on its 1Q25 earnings call, but key annual highlights are included above for the sake of simplicity
Interactive Brokers Group, Inc. (IBKR)
Source: Company documents
Note: IBKR provided additional guidance points / commentary on its 1Q25 earnings call, but key annual highlights are included above for the sake of simplicity
The Charles Schwab Corporation (SCHW)

Thanks for the comprehensve weekly recap. The NDAQ update was paticularly useful for tracking their volume trends. I noticed that even though equity ADV was down month over month as volatility cooled from April highs, the year over year growth is still solid double digits across the board. It seems like their diversification away from purely transaction based revenu is helping smooth out the earnings volatility we're seeing with some other exchanges. Looking forward to hearing what comes out of the Morgan Stanley conference.