May Exchange Volumes – Volumes Came Off Record April Levels as Volatility Cooled Meaningfully
Monthly Recap of Exchange Volumes for May and EPS Impacts for the Exchanges

In May, average volume and volatility metrics generally declined M/M (with many volume figures coming off record levels in April) as trade war rhetoric became somewhat more rational towards the end of April. Quarter-to-date exchange volumes continue to track mainly higher both Q/Q and Y/Y, which should lead to increased transaction-based revenues across the exchange landscape for 2Q if the current volume levels persist. Based on current QTD volume trends, I currently see 1% to 9% upside to exchange EPS estimates for 2Q (assuming current ADV levels hold through quarter-end) with CME showing the strongest volume results (implying 9% EPS upside for the quarter) and ICE showing the least amount of upside at 1%.

Source: company documents and my estimates
Industry Wide Volume Recap
Volatility
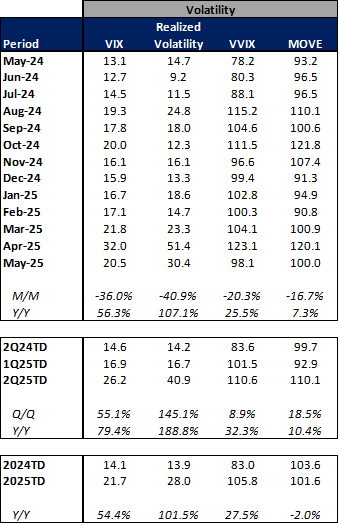
Average volatility was lower in May relative to the elevated levels experienced in April as the VIX was down 36% M/M, realized volatility (measured by the daily changes in the S&P 500) was down 41% M/M, volatility of volatility (as measured by the VVIX) was down 20% M/M and treasury volatility (as measured by the MOVE index) was down 17% M/M. Relative to a year ago, average volatility remained much higher in May with the VIX up 56% Y/Y, realized volatility up 107% Y/Y, the VVIX up 26% Y/Y and the MOVE index up 7% Y/Y.
On a quarter-to-date basis, volatility is significantly higher relative to both 1Q25-to-date and the year ago quarter-to-date. The average QTD VIX of 26.2 is up 55% Q/Q (+79% Y/Y), while realized volatility is averaging 40.9 (+145% Q/Q, +189% Y/Y), the VVIX is averaging 110.6 (+9% Q/Q, +32% Y/Y) and the MOVE index is averaging 110.1 (+19% Q/Q, +10% Y/Y).
Please note that throughout the entirety of this piece QTD averages are being calculated as through the first two months of the quarter for the current quarter to date, the prior quarter to date and the year ago quarter to date.
Average volatility levels can generally be indicative of trading activity with volumes generally increasing in periods of heightened volatility and decreasing as volatility subsides.
13 Month Trailing Volatility Metrics
Source: Yahoo Finance
U.S. Equities
Average U.S. cash equities volumes (ADV) came off record levels in April to end May at 17.6 billion shares traded per day (+41% Y/Y). The Y/Y increase was primarily driven by off-exchange volumes (Trade Reporting Facility or TRF Volume) as TRF volumes were up 52% Y/Y (-5% M/M) to 8.9 billion traded per day while on-exchange volumes were up 32% Y/Y (-13% M/M) to 8.7 billion traded per day. May marks a return to off-exchange trading outpacing on-exchange trading amidst the lower volatility environment experience during the month.
On a quarter-to-date basis, U.S. equity ADV is higher both sequentially and year over year (+19% Q/Q, +58% Y/Y). On a Y/Y basis, QTD growth is being driven by off-exchange volumes with QTD TRF ADV of 9.1 billion (+15% Q/Q, +70% Y/Y) while on-exchange volumes are averaging 9.4 billion shares per day (+23% Q/Q, +47% Y/Y).
13 Month Trailing Average Daily U.S. Cash Equities Volumes

Source: Cboe Global Markets
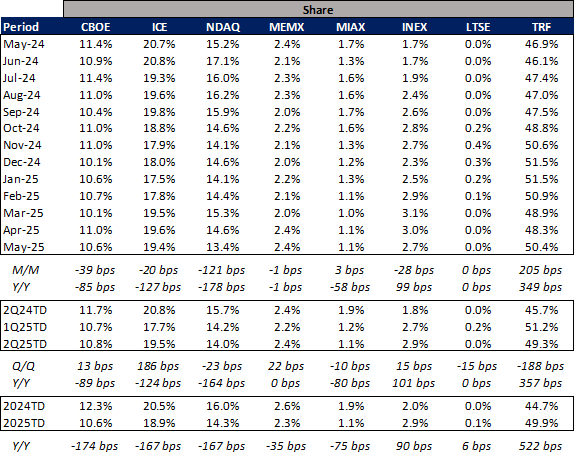
In terms of market share of U.S. cash equities volumes, the big three publicly traded U.S. exchange groups (CBOE, ICE, NDAQ) all showed declining market share in May relative to April levels as well as substantial Y/Y declines in market share for the month. CBOE posted market share of 10.6% in May (-39 bps M/M, -85 bps Y/Y), ICE posted market share of 19.4% in May (-20 bps M/M, -127 bps Y/Y) and NDAQ posted market share of 13.4% (-121 bps M/M, -178 bps Y/Y).
For the quarter-to-date, CBOE market share is averaging 10.8%, (+13 bps Q/Q, -89 bps Y/Y), ICE is averaging 19.5% (+186 bps Q/Q, -124 bps Y/Y) and NDAQ is averaging 14.0% (-23 bps Q/Q, -164 bps Y/Y).
13 Month Trailing U.S. Cash Equities Market Share
Source: Cboe Global Markets
13 Month Trailing U.S. Cash Equities Market Share
Source: Cboe Global Markets
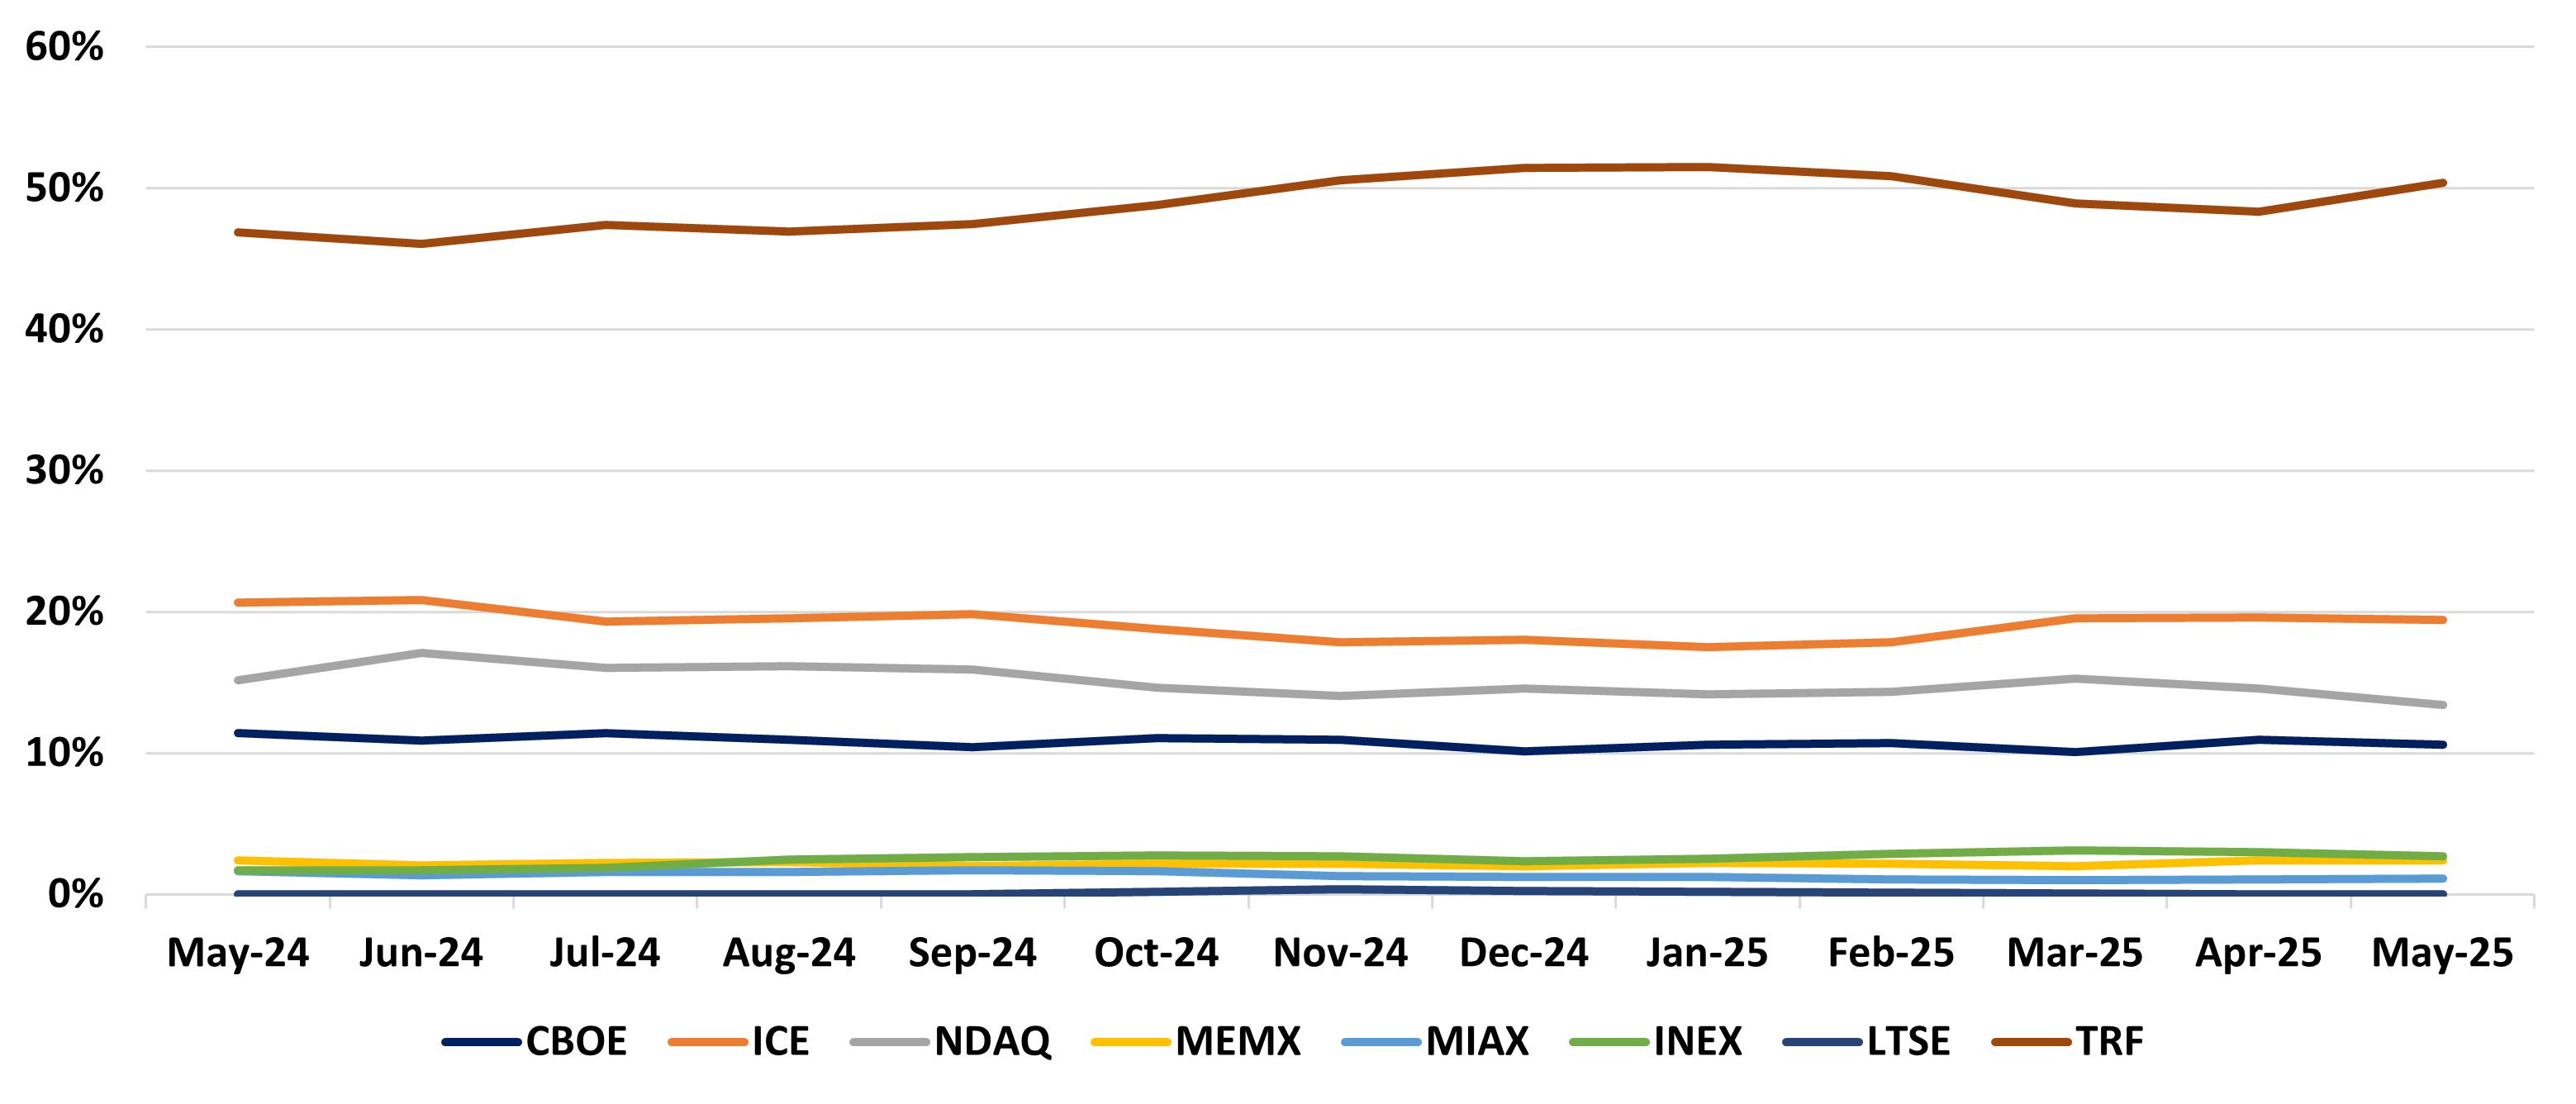
As we can see in the graph below, off-exchange volumes surpassed that of the combined market share of the big 3 publicly traded exchanges in July of 2024 and have continued to remain elevated since.
13 Month Trailing U.S. Cash Equities Market Share

Source: Cboe Global Markets
U.S. Options, Index Options and OCC Futures Volumes
Average U.S. equity options volumes were down 7% M/M in May to 51.4 million contracts traded per day but increased 27% Y/Y. Meanwhile Index option volumes were down 15% M/M in May to 4.4 million contracts per day (+15% Y/Y) and OCC Futures volumes declined 46% M/M in May to 166k contracts per day (-23% Y/Y).
On a quarter-to-date basis, U.S. equity options ADV is lower sequentially but meaningfully higher year over year as volumes are averaging 53.3 million contracts traded per day (-1% Q/Q, +30% Y/Y). Index options volumes are averaging 4.8 million contracts per day (+4% Q/Q, +16% Y/Y) while OCC Futures volumes are averaging 237k per day (+3% Q/Q, -9% Y/Y).
13 Month Trailing Average Daily U.S. Equity Options, Index and OCC Futures Volumes

Source: OCC
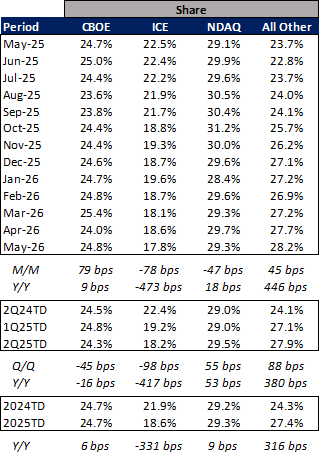
In terms of market share of U.S. equity options volumes, the big three publicly traded U.S. exchange groups (CBOE, ICE, NDAQ) showed mixed results in May relative to April and year ago levels. CBOE posted market share of 24.8% in May (+79 bps M/M, +9 bps Y/Y), ICE posted market share of 17.8% in May (-78 bps M/M, -473 bps Y/Y) and NDAQ posted market share of 29.3% (-47 bps M/M, +18 bps Y/Y).
For the quarter-to-date, CBOE market share is averaging 24.3%, (-45 bps Q/Q, -16 bps Y/Y), ICE is averaging 18.2% (-98 bps Q/Q, -417 bps Y/Y) and NDAQ is averaging 29.5% (+55 bps Q/Q, +53 bps Y/Y).
13 Month Trailing U.S. Equity Options Market Share
Source: OCC
13 Month Trailing U.S. Equity Options Market Share

Source: OCC
Company Specific Updates
Cboe Global Markets, Inc. (CBOE)
CBOE 0.00%↑ volumes ended lower in May as all product categories declined vs. April levels. U.S. cash equities ADV at CBOE was 1.9 billion for the month, down 12% M/M (+31% Y/Y). Equity options volumes at CBOE averaged 12.7 million per day (-4% M/M, +28% Y/Y). Index options ADV came in at 4.3 million in May (-15% M/M, +15% Y/Y), futures volumes ended May at 166k per day (-46% M/M, -23% Y/Y) and Global FX volumes ended the month at $51.0 billion per day (-22% M/M, +18% Y/Y).
For the quarter, volumes are mostly tracking higher both sequentially and year over year. U.S. equity options ADV is averaging 13.0 million (-3% Q/Q, +29% Y/Y), Index options ADV is tracking at 4.7 million (+5% Q/Q, +16% Y/Y), futures volumes are averaging 237k (+3% Q/Q, -9% Y/Y), U.S. equities ADV is averaging 2.0 billion (+20% Q/Q, +46% Y/Y) and Global FX ADNV is tracking at $58.2 billion (+15% Q/Q, +23% Y/Y).
CBOE Key Product Lines Trailing 13 Month ADV

Source: Cboe Global Markets and OCC
In terms of the revenue and EPS impact from the above volume statistics for CBOE, relative to last quarter’s results I see about $11 million in revenue upside to CBOE’s transaction based revenues for 2Q25. This translates into about $0.07 in EPS, or 3% upside relative to what CBOE reported for 1Q25.
Source: company documents and my estimates
CME Group Inc. (CME)
CME 0.00%↑ total volumes ended May down from the record levels posted in April. Total CME ADV decreased 20% M/M to 28.9 million contracts per day (+10% Y/Y). Interest rates ADV declined to 16.2 million per day (-12% M/M, +18% Y/Y), metals ADV fell to 0.9 million (-10% M/M, +19% Y/Y), Ags ADV declined to 1.6 million (-22% M/M, -1% Y/Y), FX ADV declined to 0.9 million (-30% M/M, -8% Y/Y), energy ADV decreased to 2.6 million (-20% M/M, +8% Y/Y) and equities ADV declined to 6.6 million (-32% M/M, -3% Y/Y). Note that it is highly irregular for CME interest rates ADV to decline M/M during the second month of the quarter, which speaks to just how volatile the trading environment was during April as Trump’s trade war kicked off and the macro-outlook shifted back and forth dramatically.
For the quarter-to-date total CME volumes are averaging 32.4 million per day (+11% Q/Q, +23% Y/Y). By contract type, Energy ADV has declined to 2.9 million per day (-3% Q/Q, +21% Y/Y), FX ADV has increased to 1.1 million per day (+4% Q/Q, +15% Y/Y), equities ADV has increased to 8.2 million per day (+15% Q/Q, +22% Y/Y), Ags ADV has declined to 1.9 million per day (-8% Q/Q, +8% Y/Y), metals ADV has increased to 1.0 million per day (+34% Q/Q, +5% Y/Y) and interest rates ADV has increased to 17.3 million per day (+14% Q/Q, +28% Y/Y).
CME Key Product Lines Trailing 13 Month ADV

Source: CME Group Inc.
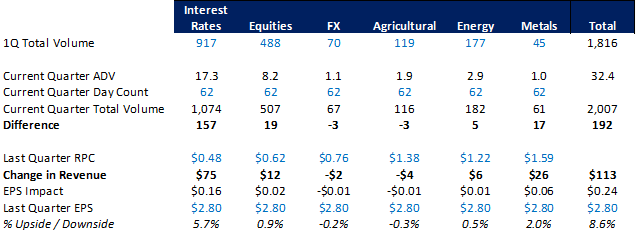
In terms of the revenue and EPS impact from the above volume statistics for CME, relative to last quarter’s results I see about $113 million in revenue upside to CME’s transaction based revenues for 2Q25. This translates into about $0.24 in EPS, or 9% upside relative to what CME reported last quarter.
Source: company documents and my estimates
Intercontinental Exchange, Inc. (ICE)
ICE 0.00%↑ volumes were lower M/M in May as volatility cooled. Total futures ADV declined to 8.4 million (-26% M/M, +13% Y/Y) as energy ADV declined to 4.6 million (-23% M/M, +9% Y/Y), interest rate ADV declined to 3.2 million (-29% M/M, +24% Y/Y) and other financials ADV decreased to 0.3 million (-36% M/M, -8% Y/Y) while ags & metals ADV fell to 0.3 million per day (-33% M/M, -14% Y/Y). U.S. options volumes declined to 9.1 million per day (-11% M/M, unchanged Y/Y) while U.S. equities volumes declined to 3.4 billion per day (-12% M/M, +30% Y/Y).
For the quarter-to-date, ICE’s volumes are mixed Q/Q but generally higher Y/Y with total futures ADV increasing to 9.9 million per day (+1% Q/Q, +28% Y/Y), U.S. options decreasing to 9.7 million per day (-6% Q/Q, +5% Y/Y) and U.S. equities ADV increasing to 3.6 billion per day (+31% Q/Q, +48% Y/Y).
ICE Key Product Lines Trailing 13 Month ADV

Source: Intercontinental Exchange, Inc., Cboe Global Markets and OCC
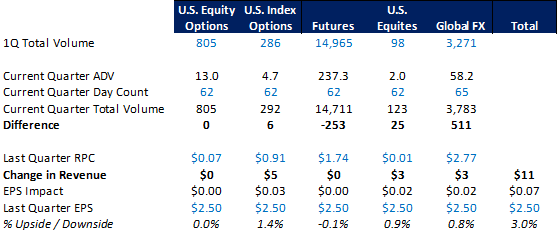
In terms of the revenue and EPS impact from the above volume statistics for ICE, relative to last quarter’s results I see about $16 million in revenue upside to ICE’s transaction-based revenues for 2Q25. This translates into about $0.02 in EPS, or 1% upside relative to what ICE reported last quarter.

Source: company documents and my estimates
Nasdaq, Inc. (NDAQ)
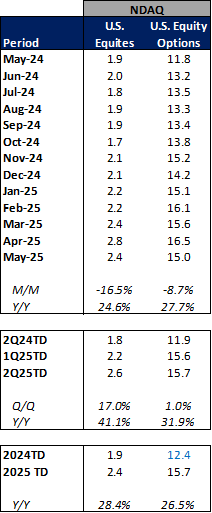
NDAQ 0.00%↑ volumes were lower M/M but higher Y/Y in May. U.S. equities ADV declined to 2.4 billion (-17% M/M, +25% Y/Y) while U.S. equity options ADV declined to 15.0 million (-9% M/M, +28% Y/Y).
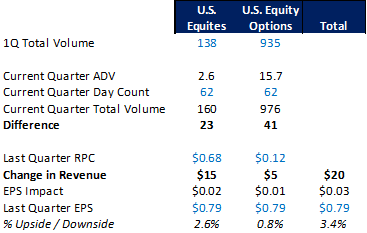
For the quarter-to-date, NDAQ volumes have increased sequentially and Y/Y. U.S. equities ADV is tracking at 2.6 billion (+17% Q/Q, +41% Y/Y) and U.S. options ADV has increased to 15.7 million (+1% Q/Q, +32% Y/Y).
NDAQ Key Product Lines Trailing 13 Month ADV
Source: Cboe Global Markets and OCC
In terms of the revenue and EPS impact from the above volume statistics for NDAQ, relative to last quarter’s results I see about $20 million in revenue upside to NDAQ’s transaction based revenues for 2Q25. This translates into about $0.03 in EPS, or 3% upside relative to what NDAQ reported last quarter.