


Fixed Income Trading Platforms - May Metrics
Monthly Recap of Fixed Income Trading Platform Volumes and Market Share Statistics

This morning, both MKTX 0.00%↑ and TW 0.00%↑ reported monthly volume statistics for May. Similar to what we saw across the exchange landscape, volumes generally declined M/M but were dramatically higher Y/Y. For MKTX, ADV declined 20% M/M but increased 44% Y/Y to $46.2B. For TW, ADV declined 6% M/M but increased 33% Y/Y to $2.5T.
MarketAxess Holdings Inc. (MKTX)
MKTX reported total credit ADV of $16.3B, which was down 11% M/M but up 22% Y/Y. U.S. High Grade (USHG) ADV came in at $7.6B (-11% M/M, +25% Y/Y) while U.S. High Yield (USHY) ADV came in at $1.6B (-19% M/M, +21% Y/Y). EM ADV ended the month at $3.6B (-15% M/M, +18% Y/Y), while Eurobonds finished the month at $2.9B (+3% M/M, +26% Y/Y) and other credit ADV came in at $612M (-17% M/M, +5% Y/Y).
Total rates ADV for the month came in at $29.9B (-24% M/M, +59% Y/Y). Muni bond ADV finished the month at $611M (-17% M/M, +6% Y/Y) while U.S. Government bond ADV came in at $28.3B (-25% M/M, +57% Y/Y) and other rates ADV finished May at $1.6B (+39% M/M, +118% Y/Y).
In terms of MKTX reported market share statistics, MKTX picked up 4bps of market share in USHG trading for the month (+66bps Y/Y), finishing May with market share of 19.3%. Notably, this marked the second month in a row where MKTX picked up market share in USHG trading on a Y/Y basis, the first time we have seen back-to-back months of market share gains since November 2023. Within USHY, MKTX reported market share of 12.2% (-135bps M/M, -64bps Y/Y). While this marked the 24th consecutive month of Y/Y market share declines for MKTX within USHY the pace of decline remains much lower than we saw through the end of 2023 and entirety of 2024. In terms of U.S. Government bonds, MKTX reported market share of 2.6% (-24bps M/M, +38bps Y/Y) as MKTX continues to pick up market share within this product category on a Y/Y basis. Meanwhile, market share of Muni bonds came in at 5.9% (+115bps M/M, -217bps Y/Y).
MKTX also provided commentary on fee per million statistics for the month, noting that credit fee per million came in at $138 for May (unchanged M/M, -7% Y/Y) while rates fee per million came in at $3.75 (unchanged M/M, -15% Y/Y). MKTX attributed the Y/Y decline in credit fee per million to protocol mix while the decline in rates fee per million was attributed to product mix.
Based on these results, I did raise my EPS estimate for the quarter a bit to reflect the continuation of strong volumes QTD. However, I lowered my ’26 estimate slightly reflecting a bit more pressure on fee per million than I had originally anticipated given prolonged mix shifts.
MKTX Reported Monthly ADV and Market Share Statistics

Source: company documents
Tradeweb Markets Inc. (TW)
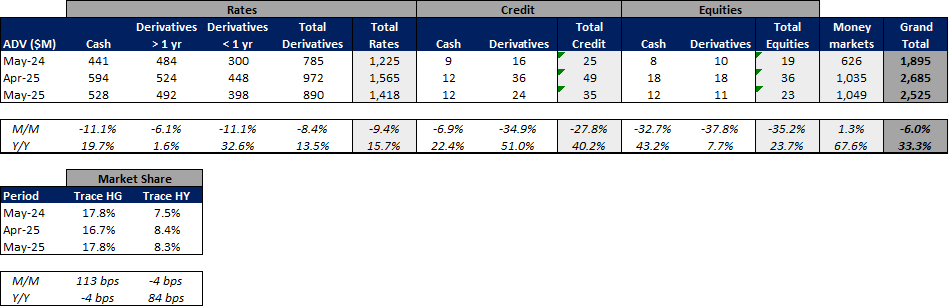
TW reported total rates ADV of $1.4T (-9% M/M, +16% Y/Y) as cash rates ADV came in at $528B (-11% M/M, +20% Y/Y) and derivatives ADV came in at $890B (-8% M/M, +14% Y/Y).
Total credit ADV for the month was $35B (-28% M/M, +40% Y/Y) with cash rates ADV of $12B (-7% M/M, +22% Y/Y) and derivatives ADV of $24B (-35% M/M, +51% Y/Y).
Equities ADV ended the month at $23B (-35% M/M, +24% Y/Y) as cash equities ADV came in at $12B (-33% M/M, +43% Y/Y) and derivatives ADV came finished the month at $11B (-38%M/M, +8% Y/Y).
Money markets ADV finished May at $1.0T (+1% M/M, +68% Y/Y). In its press release, TW noted that excluding its acquisition of ICD, which closed on August 1, 2024, total ADV would have been up 20.3% Y/Y vs. the reported +33% Y/Y, which implies that money markets ADV would have increased 28% Y/Y, excluding the impact of ICD.
In terms of TW reported market share statistics, TW picked up 113bps of market share in USHG trading for the month (-4bps Y/Y), finishing May with market share of 17.8%. Within USHY, TW reported market share of 8.3% (-4bps M/M, +84bps Y/Y). This marked the 8th consecutive month of Y/Y share gains within USHY trading for TW.
Based on these results, I raised my EPS estimate for 2Q25 slightly to account for the continued strong volume environment but made no major adjustments to my 2026 estimates. My estimate for 2Q25 assumes fee capture remains relatively consistent with 1Q25 reported results, for the time being.
TW Reported Monthly ADV and Market Share Statistics
Source: company documents
U.S. High Grade and U.S. High Yield Credit Market Share
When comparing market share of USHG and USHY credit between the two companies, both report ever so slightly different figures for TRACE volumes (industry volume from FINRA) each month. I’ve found it easiest to just compare reported ADV between MKTX and TW and look at which of the two is gaining relative to the other. Note, for this exercise we compare MKTX reported USHG and USHY volumes versus TW reported fully electronic USHG and fully electronic USHY volume.
Based on this view of market share, we can see that volumes between the two companies within USHG converged around 1Q24 and have been roughly evenly split since, with share bouncing back and forth a bit each month. Within USHY, MKTX still commands about 60% of total volume between the two, which has remained fairly stable since around 3Q24 after narrowing significantly between 2020 and mid-2024.
MKTX vs. TW USHG Credit Market Share

Source: company documents
MKTX vs. TW USHY Credit Market Share
