


Weekly Recap for Week Ended May 9, 2025
Weekly Recap of Major Micro / Macro Data Points and Things to Look Forward to in the Week Ahead

Company Specific Updates for Week Ended May 9, 2025
This past week wrapped up 1Q25 EPS for the group with MKTX reporting results. From here through July, when the group begins reporting 2Q25 EPS, we’ll be getting formal monthly metrics updates from each company, but we’ll also be paying close attention to the macro environment and daily volume detail from the exchanges to monitor any shifts in the landscape for these companies.
Exchanges
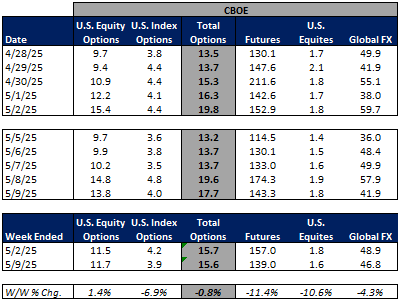
Cboe Global Markets, Inc. (CBOE)
April volumes were up double digits Y/Y across all products except Futures contracts, which were flat Y/Y and Japanese equities, which were down 24% Y/Y
Index option ADV was the second-best month on record at 5.1M contracts
Several single day volume records were set on April 4, including:
31.0M option contracts
8.8M index options contracts
6.0M S&P 500 index options contracts
437k contracts traded during global trading hours
Full breakdown of exchange volumes for the month and EPS impacts available here
CME Group Inc. (CME)
Farmer sentiment improves as long-term optimism outweighs tariff concerns
The Purdue University/CME Group Ag Economy Barometer rose 8 points to a reading of 148, up from 140 in March. The Index of Current Conditions climbed 9 points to 141, while the Index of Future Expectations increased 8 points to 152
The improvement in sentiment came amid ongoing tensions with many of U.S. agriculture's largest trading partners, including Mexico and Canada. Notably, a majority of producers said they believe the increased use of tariffs will ultimately benefit the U.S. agricultural economy, a view reflected in the stronger future expectations reading
Announces preliminary results from annual meeting of shareholders
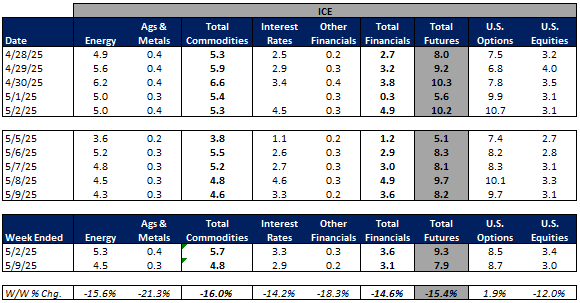
Intercontinental Exchange, Inc. (ICE)
Reports April Volume and RPC Metrics
Record total April futures ADV of 11.5M
Record energy ADV of 6.0M
Record financials ADV of 4.9M
U.S. equity options ADV up 10% Y/Y to 10.3M
U.S. equities ADV up 66% Y/Y to 3.8B
Full breakdown of exchange volumes for the month and EPS impacts available here
Mortgage Monitor: First-Time Homebuyers Comprise Record Share of Agency Purchase Lending in Q1 2025
FTHB made up 58% in 1Q25
Gen Z accounts for 1 in 4 loans to FTHB
FTHB down payments lag repeat buyers by $80k
Expands Fixed Income Liquidity Offering With Launch of Price Improvement Volume Clearing
new follow-on auction session that allows dealers to increase their volume in names that traded during the initial RMA session, along with the opportunity to improve prices for bonds that did not trade in the initial session, encouraging tighter spreads and deeper participation
ICE and OPEN Introduce New Benchmark for Tracking 20 U.S. Venture-Backed Unicorns
new benchmark designed to track the performance of 20 of the largest U.S.-based, privately held, venture-backed Unicorn companies
Expands Geospatial Platform to Include 20,000 Global Corporates and Sovereigns
Nasdaq, Inc. (NDAQ)
ADV across U.S. Equities, U.S. Options, and E.U. equities were all up dramatically Y/Y while E.U. Options and Futures were down 2% Y/Y
Full breakdown of exchange volumes for the month and EPS impacts available here
Fixed Income Trading Platforms
MarketAxess Holdings Inc. (MKTX)
Spencer Lee to Join MarketAxess as Head of Client Products, Americas
responsible for the business and product management across U.S. high-grade, U.S. high-yield, municipals, dealer and client solutions, as well as MarketAxess X-Pro
most recently held the role of Chief Markets Officer at TS Imagine
has over two decades of experience as a fixed-income trader, where he was an advocate for the adoption of technology and the development of systematic trading of credit securities
Prior to TS Imagine, he co-founded Agilon Capital, a systematic credit hedge fund, and led global credit electronic trading and West Coast fixed-income trading at BlackRock
Reported record April total credit ADV of $18.4B (+3% M/M, +32% Y/Y)
Reported total April rates ADV of $39.1B (+36% M/M, +93% Y/Y)
USHG market share was roughly flat M/M at 19.3% (up 130bps Y/Y)
This was the first month of Y/Y share gains since September 2024
USHY market share increased 100bps M/M to 13.5% (down 40bps Y/Y)
While market share was still down Y/Y this remained at a much slower pace of decline than we’ve seen in the past 22 months
Fee Per Million came in at $139 for credit (down from $140 reported in 1Q25) and $4.23 for rates (down from $4.32 reported in 1Q25)
MKTX attributed the deterioration to product mix
Reports 1Q25 Adjusted EPS of $1.87 vs. consensus of $1.81
Revenue was 1% below street estimates
Pre-tax income beat by 7%
A full recap of MKTX results is available here
Tradeweb Markets Inc. (TW)
Total April ADV came in at $2.7T (+39% Y/Y)
Recall on its 1Q25 earnings call, TW had indicated April ADV was trending up 30% Y/Y
Total Rates ADV came in at $1.6T
Total Credit ADV came in at $49B
USHG Credit Fully Electronic Market Share 16.7% (-170bps M/M, -310bps Y/Y)
USHY Credit Fully Electronic Market Share 9.0% (+70bps M/M, +100bps Y/Y)
Total Equities ADV came in at $36B
Total Money Market ADV came in at $1.0T
Online Brokers
Interactive Brokers Group, Inc. (IBKR)
Expands Access to Prediction Markets with Nearly 24/6 Trading
Eligible clients can now trade Forecast Contracts nearly 24 hours a day, Sunday through Friday
The Charles Schwab Corporation (SCHW)
Charles Schwab Challenge Champion’s Prize Revealed as 1992 Schwab Defender
STAX Score Plunges Amid April Volatility
Decreased to 41.18 in April, down from its score of 48.36 in March
The reading for the four-week period ending April 25, 2025, ranks “low” compared to historic averages
Note: Within the company guidance tracker section of this post, MKTX’s guidance table has been updated to reflect commentary from this week’s earnings call.
Company Specific Updates Anticipated for the Upcoming Week (Ended May 16, 2025)
Exchanges
None to Note
Fixed Income Trading Platforms
None to Note
Online Brokers
Robinhood Markets, Inc. (HOOD)
Apr. Metrics Release – Tuesday, May 13, post-close
The Charles Schwab Corporation (SCHW)
Apr. Metrics Release – Wednesday, May 14, pre-market
Next Four Weeks Calendar
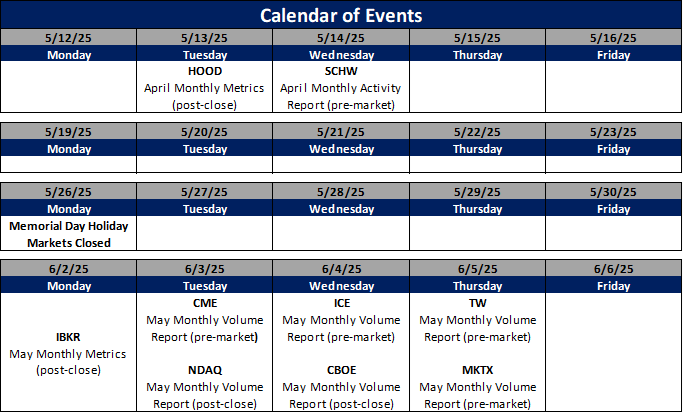
Source: Company press releases and my estimates around timing
Major Macro Updates for Week Ended May 9, 2025
S&P Final U.S. Services PMI (Apr.) – 50.8 vs. consensus 51.0 and prior 51.4
ISM Services (Apr.) – 51.6% vs. consensus 50.4% and prior 50.8%
U.S. Trade Deficit (Mar.) – 140.5B vs. consensus 137.6B and prior $123.2B
FOMC May Rate Decision – As was widely anticipated, the Fed held rates steady at 4.25% - 4.5%. The Fed statement did note that uncertainty about the economic outlook has increased further and that the committee judges that risks of higher unemployment and higher inflation have risen since its last meeting in March.
Consumer Credit (Mar.) – $10.1B vs. consensus $9.0B prior ($613)M
Initial jobless claims (week ended May 3) – 228k vs. consensus 230k and prior 241k
U.S. Productivity (1Q) – (0.8%) vs. consensus (0.7%) and prior 1.7%
Wholesale Inventories (Mar.) – 0.4% vs. consensus 0.5% and prior 0.5%
Major Macro Updates Scheduled for the Upcoming Week (Ended May 16, 2025)
Monday, May 12
Monthly U.S. Federal Budget (Apr.) – consensus $256B and prior $210B
Tuesday, May 13
NFIB Optimism Index (Apr.) – consensus 95.0 and prior 97.4
Consumer Price Index (Apr.) – consensus 0.2% and prior (0.1%)
Consumer Price Index Y/Y (Apr.) – consensus 2.3% and prior 2.4%
Core Consumer Price Index (Apr.) – consensus 0.3% and prior 0.1%
Core Consumer Price Index Y/Y (Apr.) – consensus 2.8% and prior 2.8%
Wednesday, May 14
None to Note
Thursday, May 15
Initial jobless claims (week ended May 10) – consensus 227k and prior 228k
U.S. Retail Sales (Apr.) – consensus 0.1% and prior 1.4%
Retail Sales Minus Autos (Apr.) – consensus 0.3% and prior 0.5%
Producer Price Index (Apr.) – consensus 0.3% and prior (0.4%)
Core Producer Price Index (Apr.) – consensus 0.3% and prior (0.1%)
Producer Price Index Y/Y (Apr.) – prior 2.7%
Core Producer Price Index Y/Y (Apr.) – prior 3.4%
Empire State Manufacturing Survey (May) – consensus (8.0) and prior (8.1)
Philadelphia Fed Manufacturing Survey (May) – consensus (10.0) and prior (26.4)
Industrial Production (Apr.) – consensus 0.1% and prior (0.3%)
Capacity Utilization (Apr.) – consensus 77.9% and prior 77.8%
Business Inventories (Mar.) – consensus 0.2% and prior 0.2%
Homebuilder Confidence Index (May) – consensus 40 and prior 40
Friday, May 16
Import Price Index (Apr.) – consensus (0.4%) and prior (0.1%)
Import Price Index Minus Fuel (Apr.) – prior 0.1%
Housing Starts (Apr.) – consensus 1.36M and prior 1.32M
Building Permits (Apr.) – consensus 1.45M and prior 1.48M
Preliminary Consumer Sentiment (May) – consensus 53.0 and prior 52.2
Exchange Volume Update
Exchange Volumes Over Past Week and W/W Trends
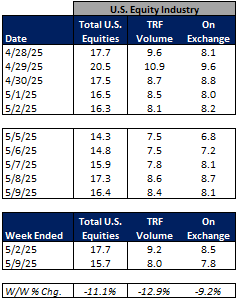
For the week ended May 9, 2025, volatility and volumes declined W/W.
The average VIX for the week was down 4% from the prior week, average realized volatility declined 32% W/W, average volatility of volatility (as measured by the VVIX) was down 2% W/W and the average MOVE index (U.S. Treasuries volatility) was down 6% W/W.
Futures average daily volumes (ADV) were lower as CBOE futures volumes were down 11% W/W, CME futures volumes were down 15% W/W, and ICE futures volumes were down 15% W/W.
Total U.S. Equities ADV was down 11%W/W, mainly driven by off-exchange trading as TRF volumes were down 13% W/W. Industry equity options volumes were down 1% W/W while index options volumes declined 7% W/W.
For further detail on weekly volume trends by exchange and by product line please see the charts below.
CME Futures Volumes (M)
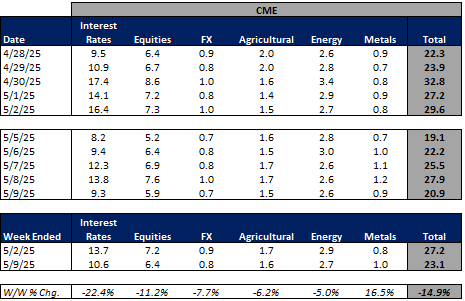
Source: Company Daily Volume Releases
ICE Futures (M), U.S. Equities (B) and U.S. Equity Options (M) Volumes
Source: Company Daily Volume Releases, Cboe Global Markets and OCC
CBOE Options (M), Futures (K), U.S. Equity (B), and FX Volumes ($B)
Source: Company Daily Volume Releases and OCC
NDAQ U.S. Equity (B) and Option (M) Volumes

Source: Cboe Global Markets and OCC
U.S. Total Industry Equity Volumes (B)
Source: Cboe Global Markets
U.S. Total Industry Equity Option and Index Option Volumes (M)

Source: OCC
Volatility Metrics

Source: Yahoo Finance
Exchange Volumes MTD / QTD / YTD Trends
Exchange volumes are tracking lower in May-to-date relative to April but are generally higher Y/Y. This comes as volatility is up MTD on a Y/Y basis.
The average VIX in May-to-date is up 79% Y/Y while realized volatility is up 209% Y/Y and volatility of volatility is up 27% Y/Y. Treasuries volatility is higher as well Y/Y as the average MOVE index in May-to-date is up 10% Y/Y.
Futures volumes are mixed Y/Y as ICE futures MTD ADV is up 11% vs. May 2024 ADV. Meanwhile, CME ADV is down 6% Y/Y while CBOE futures ADV is down 34% Y/Y.
In terms of equities and options volumes, total U.S. equities ADV is up 28% MTD while option volumes are up 23% for equity options and up 7% for index options.
For further details on MTD / QTD and YTD ADV please see the charts below.
CME Futures Volumes (M)
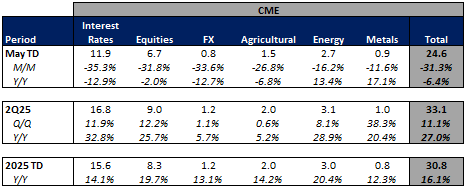
Source: Company Daily Volume Releases
ICE Futures (M), U.S. Equities (B) and U.S. Equity Options (M) Volumes

Source: Company Daily Volume Releases, Cboe Global Markets and OCC
CBOE Options (M), Futures (K), U.S. Equity (B), and FX Volumes ($B)

Source: Company Daily Volume Releases and OCC
NDAQ U.S. Equity (B) and Option (M) Volumes
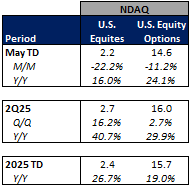
Source: Cboe Global Markets and OCC
U.S. Total Industry Equity Volumes (B)
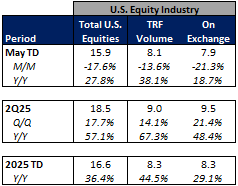
Source: Cboe Global Markets
U.S. Total Industry Equity Option and Index Option Volumes (M)

Source: OCC
Volatility Metrics

Source: Yahoo Finance
Major Indices, Interest Rates and Company Share Price Trends
The market fell slightly on the week (down 50 bps W / W) despite Trump’s announcement of a trade deal with the U.K and the administration’s announcement of talks with China beginning this weekend. The week was highlighted by some mixed earnings announcements early in the week and the market generally trading cautiously ahead of the FOMC decision on Wednesday. At its meeting, the FOMC held rates steady at 4.25% - 4.50%, however commentary in the statement suggested the Fed is growing more uncertain on the economic outlook and fearful of a stagflationary scenario ahead.
In terms of the companies I follow, there was no real standout group over the last week other than the performance of HOOD which was up 12.5% W / W given the strong performance of bitcoin and renewed enthusiasm during the week. Within the exchanges, all were up 1-3% on limited major micro news (ICE, NDAQ and CBOE all reported monthly volumes this week though much of that information was known prior to the releases). SCHW and IBKR were both up 2%, again on limited micro news. Within the Fixed Income Trading space, MKTX was up 2% after reporting both monthly volumes for April (showing an increase in market share in USHG for the first time since September 2024) and 1Q25 EPS (with a revenue miss but expense and EPS beat), while TW was up 4% after reporting volumes for April (showing a decrease in market share in USHG but an increase in USHY). To me, MKTX should have been the stronger performer of the two over the past week as I liked its earnings results and thought the April volume update was an incremental positive.
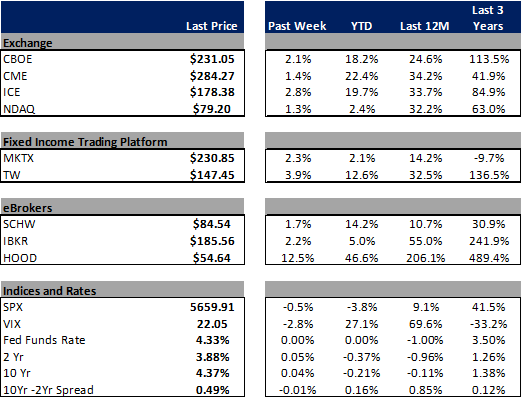
Source: Yahoo Finance, FRED, U.S. Department of the Treasury
Comp Sheet

Source: PitchBook
Guidance Tracker
Exchanges
Cboe Global Markets, Inc. (CBOE)
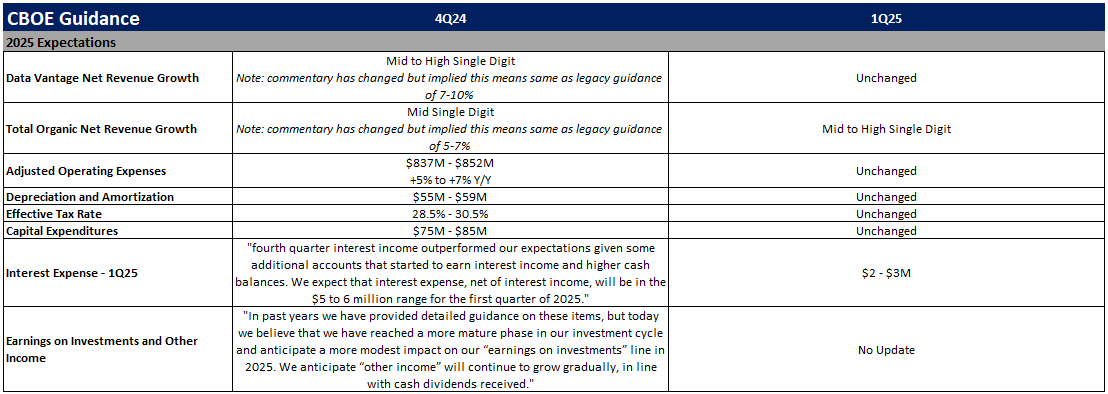
Source: Company documents
Note: CBOE provided additional guidance points / commentary on its 1Q25 earnings call, but key annual highlights are included above for the sake of simplicity
CME Group Inc. (CME)

Source: Company documents
Note: CME provided additional guidance points / commentary on its 1Q25 earnings call, but key annual highlights are included above for the sake of simplicity
Intercontinental Exchange, Inc. (ICE)

Source: Company documents
Note: ICE provided additional guidance points / commentary on its 1Q25 earnings call, but key annual highlights are included above for the sake of simplicity
Nasdaq, Inc. (NDAQ)

Source: Company documents
Note: NDAQ provided additional guidance points / commentary on its 1Q25 earnings call, but key annual highlights are included above for the sake of simplicity
Fixed Income Trading Platforms
MarketAxess Holdings Inc. (MKTX)

Source: Company documents
Note: MKTX provided additional guidance points / commentary on its 1Q25 earnings call, but key annual highlights are included above for the sake of simplicity
Tradeweb Markets Inc. (TW)

Source: Company documents
Note: TW provided additional guidance points / commentary on its 1Q25 earnings call, but key annual highlights are included above for the sake of simplicity
Online Brokers
Robinhood Markets, Inc. (HOOD)

Source: Company documents
Note: HOOD provided additional guidance points / commentary on its 1Q25 earnings call, but key annual highlights are included above for the sake of simplicity
Interactive Brokers Group, Inc. (IBKR)
Source: Company documents
Note: IBKR provided additional guidance points / commentary on its 1Q25 earnings call, but key annual highlights are included above for the sake of simplicity
The Charles Schwab Corporation (SCHW)
