

Weekly Recap for Week Ended March 21, 2025
Weekly Recap of Major Micro / Macro Data Points and Things to Look Forward to in the Week Ahead

Significant News / Developments from Week Ended Mar. 21, 2025
Nasdaq Announces Second Headquarters in Dallas, Texas
This past week, Nasdaq (NDAQ) announced that it was opening a second headquarters in Dallas. Back in February, I wrote that I would not be surprised to see an announcement coming out of Nasdaq after Intercontinental Exchange (ICE 0.00%↑) announced plans to relocate its Chicago stock exchange to Texas. Both announcements follow the founding of the Texas Stock Exchange (TXSE) in Dallas as an alternative to the entrenched national exchanges in New York. Given the more relaxed regulatory / tax regime in Texas, the migration of numerous companies to states with lower tax rates and lighter regulations, as well as the broadly more business friendly political regime in the country I view these announcements as table stakes for the exchanges to defend market share against the Texas upstart. While TXSE has a long road ahead to gain listings / trading share it is clear that competition is increasing in the exchange space as listed companies grow frustrated with regulatory oversight and listings standards currently in place.
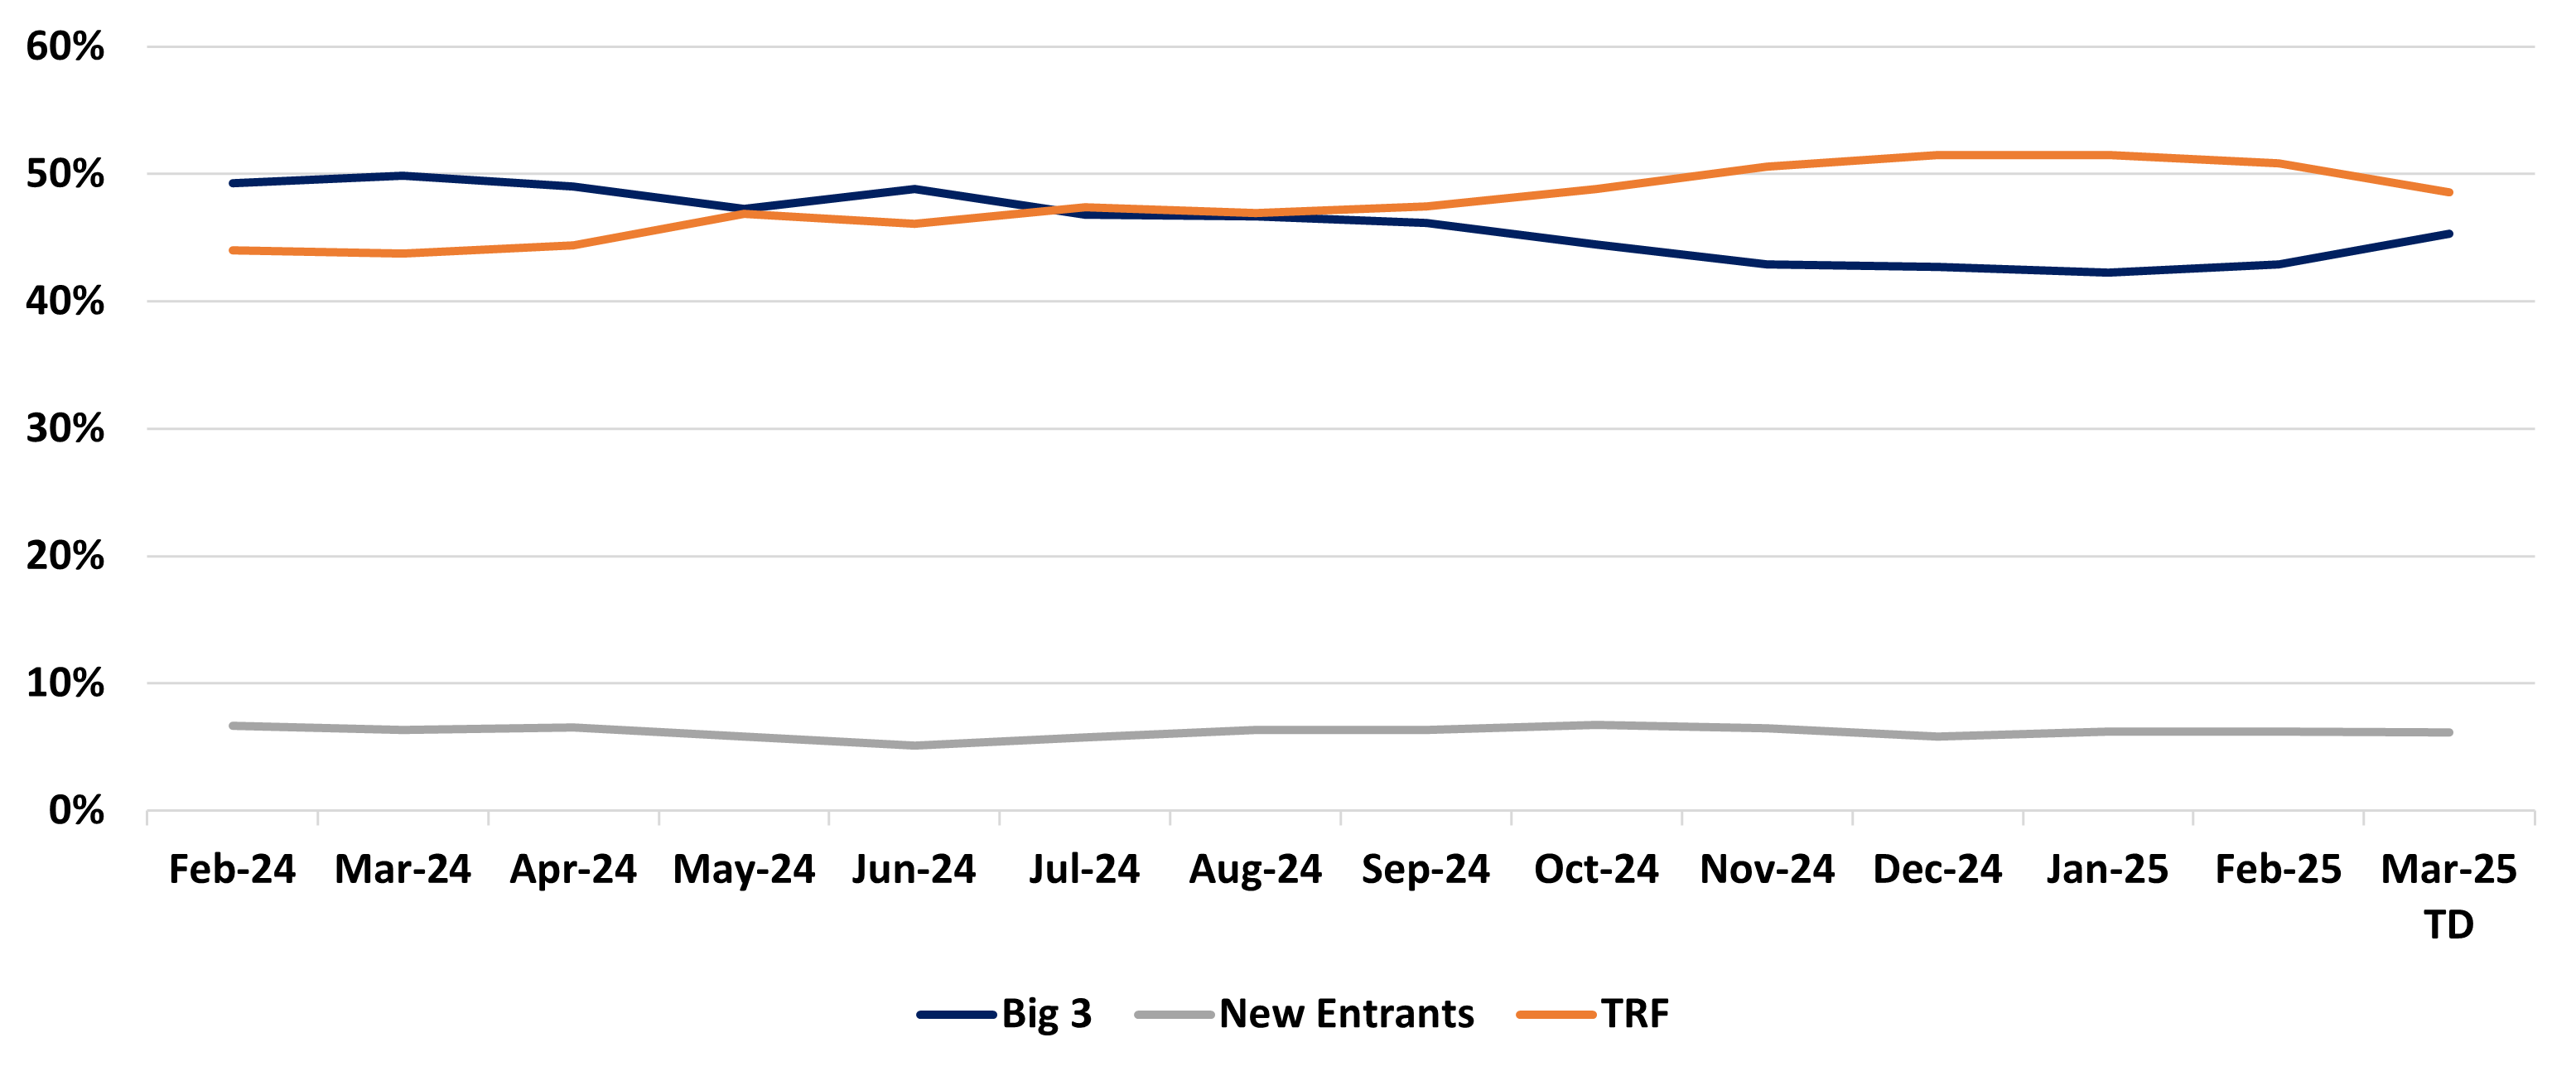
However, for some context around the challenging road ahead for TXSE, over the past ~8 years four other upstart exchanges have launched equity trading and listing venues in the U.S. Collectively these new entrants have only managed to garner 6% market share (graphs below) of U.S. equities trading, the largest of which, IEX, has only managed to take 3% share. This compares to ICE’s market share at 19.5%, NDAQ’s at 15.5%, Cboe Global Markets (CBOE 0.00%↑) at 11% and off-exchange trading making up 50% of U.S. equity trading volumes in recent months. While garnering significant market share for TXSE will be challenging in the years ahead, I appreciate additional competition in the space and will be very interested in the developments that take place in the exchange space in the coming months and years.
Source: Cboe Global Markets
U.S. Equity Trading Market Share By Exchange Type
Source: Cboe Global Markets
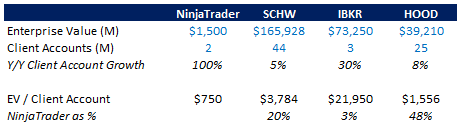
Kraken Announces Acquisition of NinjaTrader
On Thursday, March 20, Kraken, the cryptocurrency exchange, announced that it was acquiring retail futures trading platform NinjaTrader for $1.5B. NinjaTrader is a Futures Commission Merchant (FCM), registered with the CFTC allowing its retail trader base of nearly 2 million clients to trade futures contracts across equities, commodities, cryptocurrencies, etc. The combination of the two platforms will broaden Kraken’s ability to offer multi-asset class trading and access to professional trading analytics tools and liquidity. The deal combines a traditional trading platform with one of the leading crypto exchanges.
Given the blending of traditional finance and crypto we have seen over the past few years, (CME, CBOE, ICE and NDAQ 0.00%↑ all offer a digital currency product in some form), the transaction makes a lot of sense and has the potential to greatly expand and advance the trading landscape. Further, the traditional exchanges have been focusing on products catered to the retail trader in recent years and crypto exchanges typically cater to a retail base, so the combination of the two businesses has potential to provide some benefit for products such as CME 0.00%↑’s retail sized futures products and CBOE’s options complex. I would not be surprised to see similar announcements, blending traditional finance and crypto in the coming years and view this as another step in the rise of the retail trader.
While there is limited financial detail available for NinjaTrader, the $1.5B sale price amounts to about $750 per client account. This compares to SCHW 0.00%↑’s enterprise value of about $3,800 per client account, IBKR 0.00%↑’s enterprise value of about $22,000 per client account and HOOD 0.00%↑’s enterprise value of about $1,600 per client account. According to its website, NinjaTrader had over 1M accounts at the beginning of 2024. Given current account base of about 2M, NinjaTrader has grown accounts ~100% since the beginning of last year. This compares to SCHW’s client account growth of 5% over the same time frame, IBKR’s client account growth of 30% and HOOD’s funded client account growth of 8%.
Source: company documents
Company Specific Updates for Week Ended Mar. 21, 2025
Exchanges
Cboe Global Markets, Inc. (CBOE)
Announces Date of First-Quarter 2025 Earnings Release and Conference Call
Friday, May 2 pre-market
CME Group Inc. (CME)
Expands Credit Products with High Yield Duration-Hedged Futures
Launching BrokerTec U.S. Treasury Central Limit Order Book in Chicago
New CLOB will be co-located in Chicago next to CME’s U.S. Treasury futures and options markets
Offering smaller notional sizes and tighter price increments to allow more precise hedging with CME’s futures market
Available for client testing beginning on April 27, 2025
Nasdaq, Inc. (NDAQ)
Planning second U.S. headquarters in Texas
Follows an announcement from ICE that it was planning to launch an exchange in Texas and follows the announcement last summer that TSXE was planning to launch an exchange and listing venue in the state
View this as becoming table stakes with the exchanges as there will now be 3 listings venues within the state
NDAQ noted it generates about $750 million in revenues in Texas and the Southwest region of the U.S., which is meaningful at about 16% of NDAQ 2024 total net revenue
Also noted it partners with 2,000 clients in the region, 800 of which are based in Texas, and that there are 200 NDAQ listing clients headquartered in the state, representing almost $2T in market cap (as of December)
Intercontinental Exchange, Inc. (ICE)
Mortgage Delinquencies Continue to Slowly Rise with FHA Performance in the Spotlight
National delinquency rate increased slightly 3.53% in February (+5bps)
FHA mortgages accounted for 90% of the 131K year-over-year rise in the number of delinquencies
4,100 homeowners in Los Angeles are now past due as a result of the wildfires
Fixed Income Trading Platforms
None to Note
Online Brokers
None to Note
Company Specific Updates Anticipated for the Upcoming Week (Ended Mar. 28, 2025)
Exchanges
None to Note
Fixed Income Trading Platforms
None to Note
Online Brokers
None to Note
Next Four Weeks Calendar

Source: Company press releases and my estimates around timing
Major Macro Updates for Week Ended Mar. 21, 2025
U.S. Retail Sales (Feb.) – 0.2% vs. consensus 0.6% and prior (1.2%)
Retail Sales Minus Autos (Feb.) – 0.3% vs. consensus 0.3% and prior (0.6%)
Empire State Manufacturing Survey (Mar.) – (20.9) vs. consensus (1.8) and prior (2.4)
Business Inventories (Jan.) – 0.3% vs. consensus 0.3% and prior (0.2%)
Homebuilder Confidence Index (Mar.) – 39 vs. consensus 42 and prior 42
Housing Starts (Feb.) – 1.50M vs. consensus 1.38M and prior 1.35M
Building Permits (Feb.) – 1.46M vs. consensus 1.45M and prior 1.47M
Import Price Index (Feb.) – 0.4% s. consensus 0.0% and prior 0.4%
Import Price Index Minus Fuel (Feb.) – 0.3% vs. prior 0.1%
Industrial Production (Feb.) – 0.7% vs. consensus 0.3% and prior 0.3%
Capacity Utilization (Feb.) – 78.2% vs. consensus 77.8% and prior 77.7%
FOMC Rate Decision and Chair Press Conference – Fed left rates on hold, still forecasts two 25bps cuts this year but lowered GDP forecast for the year to 1.7% vs. 2.1% prior and increased inflation expectations to 2.8% from 2.5% prior
Initial jobless claims (week ended Mar. 15) – 223k vs. consensus 225k and prior 221k
Philadelphia Fed Manufacturing Survey (Mar.) – 12.5 vs. consensus 10.0 and prior 18.1
Existing Home Sales (Feb.) – 4.26M vs. consensus 3.95M and prior 4.08M
U.S. Leading Economic Indicators (Feb.) – (0.3%) vs. consensus (0.2%) and prior 0.2%
Major Macro Updates Scheduled for the Upcoming Week (Ended Mar. 28, 2025)
Monday, Mar. 24
S&P Flash U.S. Services PMI (Mar.) – consensus 51.5 and prior 51.0
S&P Flash U.S. Manufacturing PMI (Mar.) – consensus 51.5 and prior 52.7
Tuesday, Mar. 25
S&P Case-Shiller Home Price Index (Jan.) – consensus 4.4% and prior 4.5%
Consumer Confidence (Mar.) – consensus 95.0 and prior 98.3
New Home Sales (Feb.) – consensus 679k and prior 657k
Wednesday, Mar. 26
Durable Goods Orders (Feb.) – consensus (1.0%) and prior 3.2%
Durable Goods Minus Transportation (Feb.) – prior 0.0%
Thursday, Mar. 27
Initial jobless claims (week ended Mar. 22) – consensus 226k and prior 223k
GDP Second Revision (4Q24) – consensus 2.3% and prior 2.3%
Advanced U.S. Trade Balance in Goods (Feb.) – prior ($153.3B)
Advanced Retail Inventories (Feb.) – prior (0.1%)
Advanced Wholesale Inventories (Feb.) – prior 0.8%
Pending Home Sales (Feb.) – consensus 1.0% and prior (4.6%)
Friday, Mar. 28
Personal Income (Feb.) – consensus 0.4% and prior 0.9%
Personal Spending (Feb.) – consensus 0.6% and prior (0.2%)
PCE Index (Feb.) – consensus 0.3% and prior 0.3%
PCE Year over Year (Feb.) – consensus 2.5% and prior 2.5%
Core PCE Index (Feb.) – consensus 0.3% and prior 0.3%
Core PCE Year over Year (Feb.) – consensus 2.7% and prior 2.6%
Consumer Sentiment Final (Mar.) – consensus 57.9 and prior 57.9
Exchange Volume Update
Exchange Volumes Over Past Week and W/W Trends
For the week ended March 21, 2025, volumes declined week over week, while volatility metrics mainly fell as geopolitical concerns eased slightly and the Fed held rates steady following its March FOMC meeting.
The average VIX for the week was down 19% from the prior week, average realized volatility was up 9% W/W, average volatility of volatility (as measured by the VVIX) was down 20% W/W and the average MOVE index (U.S. Treasuries volatility) was down 11% W/W.
Futures average daily volumes (ADV) declined as CBOE futures volumes were down 39% W/W, CME futures volumes were down 19% W/W, and ICE futures volumes were down 5% W/W.
Total U.S. Equities ADV was down 11%W/W, mainly driven by off-exchange trading as TRF volumes were down 14% W/W. This came despite triple-witching occurring on Friday, which saw the third highest share trading volume day on record at 21B shares traded and saw a massive increase in on-exchange trading, making up 60% of the total mix for the day. Industry equity options volumes were down 16% W/W while index options volumes fell 22% W/W.
For further detail on weekly volume trends by exchange and by product line please see the charts below.
CME Futures Volumes (M)
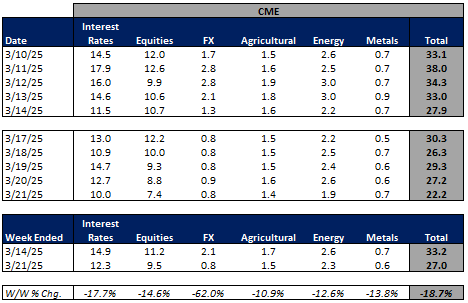
Source: Company Daily Volume Releases
ICE Futures (M), U.S. Equities (B) and U.S. Equity Options (M) Volumes
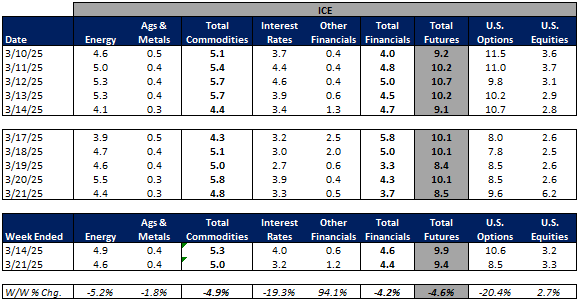
Source: Company Daily Volume Releases, Cboe Global Markets and OCC
CBOE Options (M), Futures (K), U.S. Equity (B), and FX Volumes ($B)
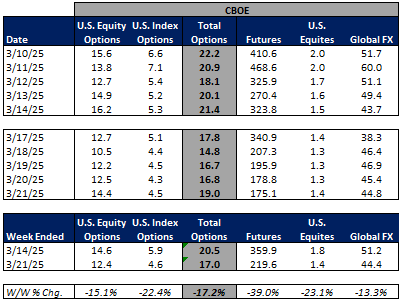
Source: Company Daily Volume Releases and OCC
NDAQ U.S. Equity (B) and Option (M) Volumes

Source: Cboe Global Markets and OCC
U.S. Total Industry Equity Volumes (B)
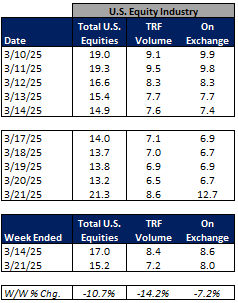
Source: Cboe Global Markets
U.S. Total Industry Equity Option and Index Option Volumes (M)
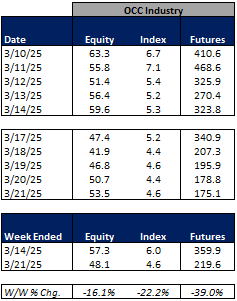
Source: OCC
Volatility Metrics
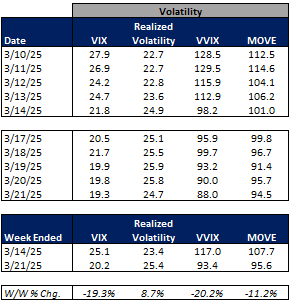
Source: Yahoo Finance
Exchange Volumes MTD / QTD / YTD Trends
Exchange volumes are tracking higher in March-to-date. This comes as volatility is up significantly MTD on a Y/Y basis.
The average VIX in March-to-date is up 66% Y/Y while realized volatility is up 62% Y/Y and volatility of volatility is up 33% Y/Y. Treasuries volatility is higher as well Y/Y as the average MOVE index in March-to-date is up 5% Y/Y.
Futures volumes are higher Y/Y as ICE futures MTD ADV is up 39% vs. March 2024 ADV. Meanwhile, CME ADV is up 37% Y/Y while CBOE futures ADV is up 46% Y/Y.
In terms of equities and options volumes, total U.S. equities ADV is up 37% MTD while option volumes are up 28% for equity options and up 33% for index options.
For further details on MTD / QTD and YTD ADV please see the charts below.
CME Futures Volumes (M)
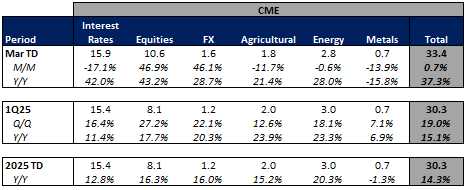
Source: Company Daily Volume Releases
ICE Futures (M), U.S. Equities (B) and U.S. Equity Options (M) Volumes
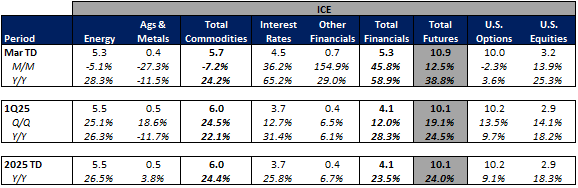
Source: Company Daily Volume Releases, Cboe Global Markets and OCC
CBOE Options (M), Futures (K), U.S. Equity (B), and FX Volumes ($B)

Source: Company Daily Volume Releases and OCC
NDAQ U.S. Equity (B) and Option (M) Volumes
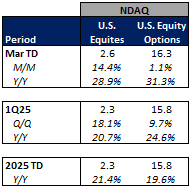
Source: Cboe Global Markets and OCC
U.S. Total Industry Equity Volumes (B)
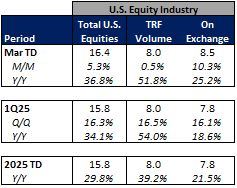
Source: Cboe Global Markets
U.S. Total Industry Equity Option and Index Option Volumes (M)

Source: OCC
Volatility Metrics

Source: Yahoo Finance
Major Indices, Interest Rates and Company Share Price Trends
Markets ended the week slightly higher with the S&P up 50bps W/W. The week was slightly calmer than we’ve seen the past few weeks as the geopolitical landscape concerns eased slightly. The Fed concluded its March meeting on Wednesday and held the Fed Funds rate steady at 4.25% - 4.50%. However, the Fed did announce that it was slowing its pace of Quantitative Tightening (QT) by reducing its monthly redemptions cap on Treasuries from $25B to $5B (maintained the monthly cap on agencies and agency mortgage debt at $35B). Additionally, the Fed noted that “uncertainty around the economic outlook has increased” vs. prior commentary stating that “the economic outlook is uncertain”. Further, in its Summary of Economic Projections (SEP) the Fed increased its expectations for core PCE inflation for this year from 2.5% to 2.8% and lowered its GDP expectations from 2.1% for the year to 1.7%. Broadly, I viewed Fed commentary / projections as modestly dovish relative to prior commentary / projections, which was reflected in yields edging down slightly and the market moving slightly higher.
In terms of the companies I follow, the online brokers showed the strongest performance (+2% to +13%) likely due to a bit of reprieve after underperformance in recent weeks. Within the exchanges, NDAQ showed the strongest performance, closing out the week up 3%. On the Fixed Income Trading Platform side, TW performed the best, increasing 5% on limited news.
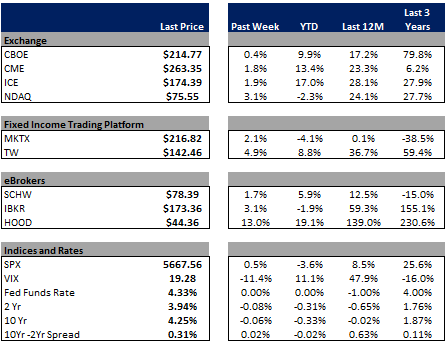
Source: Yahoo Finance, FRED, U.S. Department of the Treasury
Comp Sheet
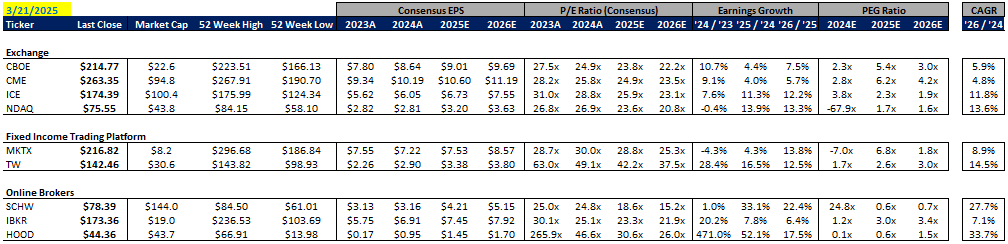
Source: PitchBook
Guidance Tracker
Exchanges
Cboe Global Markets, Inc. (CBOE)

Source: Company documents
Note: CBOE provided additional guidance points / commentary on its 4Q24 earnings call, but key annual highlights are included above for the sake of simplicity
CME Group Inc. (CME)

Source: Company documents
Note: CME provided additional guidance points / commentary on its 4Q24 earnings call, but key annual highlights are included above for the sake of simplicity
Intercontinental Exchange, Inc. (ICE)

Source: Company documents
Note: ICE provided additional guidance points / commentary on its 4Q24 earnings call, but key annual highlights are included above for the sake of simplicity
Nasdaq, Inc. (NDAQ)

Source: Company documents
Note: NDAQ provided additional guidance points / commentary on its 4Q24 earnings call, but key annual highlights are included above for the sake of simplicity
Fixed Income Trading Platforms
MarketAxess Holdings Inc. (MKTX)

Source: Company documents
Note: MKTX provided additional guidance points / commentary on its 4Q24 earnings call, but key annual highlights are included above for the sake of simplicity
Tradeweb Markets Inc. (TW)

Source: Company documents
Note: TW provided additional guidance points / commentary on its 4Q24 earnings call, but key annual highlights are included above for the sake of simplicity
Online Brokers
The Charles Schwab Corporation (SCHW)
