
Weekly Recap for Week Ended June 13, 2025
Weekly Recap of Major Micro / Macro Data Points and Things to Look Forward to in the Week Ahead

Company Specific Updates for Week Ended Jun. 13, 2025
Exchanges
Cboe Global Markets, Inc. (CBOE)
Intercontinental Exchange, Inc. (ICE)
Fixed Income Trading Platforms
None to Note
Online Brokers
Webull Corporation (BULL)
Appoints Walter Bishop to Board of Directors
Mr. Bishop will serve as a member of the Audit Committee, Compensation Committee and Nominating and Corporate Governance Committee
Mr. Bishop has previously served in a number of leadership roles within the finance industry including at Nordbanken U.S., Barclays and Deutsche Bank
Launches Kalshi's Hourly Crypto Markets on Investing Platform
U.S. users of all experience levels now able to capitalize on Bitcoin and Ethereum crypto markets in over/under prediction style
eToro Group Ltd. (ETOR)
Revenue beat street estimates by 2%
EPS beat street by 14%
2Q25-TD updated appeared slightly soft
Full recap available here
Global ‘BEACH’ stocks soar with up to 4x the gains of regional indices
Robinhood Markets, Inc. (HOOD)
Funded customers 25.9M (unchanged M/M, +7.5% Y/Y)
Platform assets $255B (+10% M/M, +89% Y/Y)
Net Deposits $3.5B, 18% annualized growth rate
Equity trading volume $181B (+14% M/M, +108% Y/Y)
Option contracts 180M (+7% M/M, +36% Y/Y)
Crypto trading volume $12B (+36% M/M, +65% Y/Y)
Margin loans $9B (+7% M/M, +100% Y/Y)
Total cash sweep $31B (+7% M/M, +52% Y/Y)
Sec lending revenue $33M (+32% M/M, +43% Y/Y)
These results were largely inline with the preview press release published on June 5
Full recap of eBroker May metrics is available here
Interactive Brokers Group, Inc. (IBKR)
Survey: Bearish on the US, Financial Advisors Increase Allocation to Global Investments
42% of are investing more in non-US equities
40% are dialing back client exposure to US equities
The Charles Schwab Corporation (SCHW)
Reduces Fees on Four Equity Index ETFs and Announces Mutual Fund Share Splits
Fee reductions go into effect June 10
Lowering fee on Schwab 1000 Index ETF from 0.05% to 0.03%
Lowering fee on Schwab International Equity ETF from 0.06% to 0.03%
Lowering fee on Schwab International Small-Cap Equity ETF from 0.11% to 0.08%
Lowering fee on Schwab Emerging Markets Equity ETF from 0.11% to 0.07%
Announced a number of mutual fund share splits to bring NAV more closely aligned with initial share price of $10
Share splits will not alter rights or change total value of shareholder’s investment
Share splits will also not be a taxable event for shareholders
Set to occur on August 15 for shareholders of record August 13
STAX Score Continues Downward Trend Despite May Rally
STAX declined to 39.68 in May from 41.18 in April
Schwab clients were sellers of equities in May with net selling the highest in Information Technology, Communication Services and Financial sectors
Self-Directed 401(k) Investors’ Balances Decrease In First Quarter Amid Market Volatility
Core NNA of $35B implied an annualized growth rate of 4.2%
Total client assets increased 5% M/M to $10.3T
Cash as a % of client assets declined to 10.1%
Transactional sweep cash declined $5.2B
Have reduced supplemental funding to $32B as of the end of May
Full recap of eBroker May metrics is available here
Company Specific Updates Anticipated for the Upcoming Week (Ended Jun. 20, 2025)
Exchanges
None to Note
Fixed Income Trading Platforms
None to Note
Online Brokers
None to Note
Next Four Weeks Calendar

Source: Company press releases and my estimates around timing
Major Macro Updates for Week Ended Jun. 13, 2025
Wholesale Inventories (Apr.) – 0.2% vs. consensus 0.2% and prior 0.3%
NFIB Optimism Index (May) – 98.8 vs. consensus 96.0 and prior 95.8
Consumer Price Index (May) – 0.1% vs. consensus 0.2% and prior 0.2%
Consumer Price Index Y/Y (May) – 2.4% vs. consensus 2.4% and prior 2.3%
Core CPI (May) – 0.1% vs. consensus 0.3% and prior 0.2%
Core CPI Y/Y (May) – 2.8% vs. consensus 2.9% and prior 2.8%
Monthly U.S. Federal Budget (May) – $316B vs. consensus $310B and prior $347B
Initial jobless claims (week ended Jun. 7) – 248k vs. consensus 246k and prior 248k
Producer Price Index (May) – 0.1% vs. consensus 0.2% and prior (0.2%)
Core PPI (May) – 0.1% vs. consensus 0.3% and prior (0.1%)
PPI Y/Y (May) – 2.6% vs. prior 2.5%
Core PPI Y/Y (May) – 2.7% vs. prior 2.9%
Preliminary Consumer Sentiment (Jun.) – 60.5 vs. consensus 54.0 and prior 52.2
Major Macro Updates Scheduled for the Upcoming Week (Ended Jun. 20, 2025)
Monday, Jun. 16
Empire State Manufacturing Survey (Apr.) – consensus 6.0 and prior (9.2)
Tuesday, Jun. 17
U.S. Retail Sales (May) – consensus (0.6%) and prior 0.1%
Retail Sales Minus Autos (May) – consensus 0.2% and prior 0.1%
Import Price Index (May) – consensus (0.2%) and prior 0.1%
Import Price Index Minus Fuel (May) – prior 0.4%
Industrial Production (May) –consensus (0.1%) and prior 0.0%
Capacity Utilization (May) – consensus 77.7% and prior 77.7%
Business Inventories (Apr.) – consensus 0.0% and prior 0.1%
Homebuilder Confidence Index (Jun.) – consensus 36 and prior 34
Wednesday, Jun. 18
Housing Starts (May) – consensus 1.37M and prior 1.36M
Building Permits (May) – consensus 1.44M and prior 1.41M
Initial Jobless Claims (week ended Jun. 14) – consensus 250k and prior 248k
FOMC Interest Rate Decision
Fed Chair Powell Press Conference
Thursday, Jun. 19
None to Note (Juneteenth Holiday)
Friday, Jun. 20
Philadelphia Fed Manufacturing Surve (Jun.) – consensus (1.0%) and prior (4.0)
U.S. Leading Economic Indicators (May) – consensus (0.1%) and prior (1.0%)
Exchange Volume Update
Exchange Volumes Over Past Week and W/W Trends
For the week ended June 6, 2025, volumes were mainly higher while volatility metrics were mixed W/W.
The average VIX for the week was up 2% from the prior week, average realized volatility fell 21% W/W, average volatility of volatility (as measured by the VVIX) was up 9% W/W and the average MOVE index (U.S. Treasuries volatility) was down 4% W/W.
Futures average daily volumes (ADV) were higher as CBOE futures volumes were up 48% W/W, CME futures volumes were up 13% W/W, and ICE futures volumes were up 22% W/W.
Total U.S. Equities ADV was up 26% W/W, as TRF volumes rose 27% W/W while on-exchange volume increased 25% W/W. Industry equity options volumes were up 4% W/W while index options volumes rose 16% W/W.
For further detail on weekly volume trends by exchange and by product line please see the charts below.
CME Futures Volumes (M)

Source: Company Daily Volume Releases
ICE Futures (M), U.S. Equities (B) and U.S. Equity Options (M) Volumes

Source: Company Daily Volume Releases, Cboe Global Markets and OCC
CBOE Options (M), Futures (K), U.S. Equity (B), and FX Volumes ($B)

Source: Company Daily Volume Releases and OCC
NDAQ U.S. Equity (B) and Option (M) Volumes

Source: Cboe Global Markets and OCC
U.S. Total Industry Equity Volumes (B)

Source: Cboe Global Markets
U.S. Total Industry Equity Option and Index Option Volumes (M)

Source: OCC
Volatility Metrics

Source: Yahoo Finance
Exchange Volumes MTD / QTD / YTD Trends
Exchange volumes are tracking mixed in June-to-date relative to May and are mixed Y/Y. This comes as volatility is up MTD on a Y/Y basis.
The average VIX in June-to-date is up 41% Y/Y while realized volatility is up 92% Y/Y and volatility of volatility is up 19% Y/Y. Treasuries volatility is lower Y/Y as the average MOVE index in June-to-date is down 3% Y/Y.
Futures volumes are mixed Y/Y as ICE futures MTD ADV is up 15% vs. May 2024 ADV. Meanwhile, CME ADV is up 1% Y/Y while CBOE futures ADV is down 21% Y/Y.
In terms of equities and options volumes, total U.S. equities ADV is up 52% MTD while option volumes are up 12% for equity options and up 12% for index options.
For further details on MTD / QTD and YTD ADV please see the charts below.
CME Futures Volumes (M)

Source: Company Daily Volume Releases
ICE Futures (M), U.S. Equities (B) and U.S. Equity Options (M) Volumes

Source: Company Daily Volume Releases, Cboe Global Markets and OCC
CBOE Options (M), Futures (K), U.S. Equity (B), and FX Volumes ($B)

Source: Company Daily Volume Releases and OCC
NDAQ U.S. Equity (B) and Option (M) Volumes

Source: Cboe Global Markets and OCC
U.S. Total Industry Equity Volumes (B)

Source: Cboe Global Markets
U.S. Total Industry Equity Option and Index Option Volumes (M)

Source: OCC
Volatility Metrics

Source: Yahoo Finance
Major Indices, Interest Rates and Company Share Price Trends
The market declined slightly on the week (down 40 bps W/W) while treasury yields fell about 10bps W/W.
In terms of the companies I follow, the online brokers remain a wild space to watch with ETOR down 10% after releasing earnings results on Wednesday while HOOD declined 3%, IBKR was down 5%, BULL declined 5% and SCHW was down 1%. The exchanges were mixed with CBOE up 1% CME falling 2% while ICE and NDAQ were flat on the week. MKTX rose 1% on the week while TW fell 2%.

Source: Yahoo Finance, FRED, U.S. Department of the Treasury
Comp Sheet

Source: Yahoo Finance
Guidance Tracker
Exchanges
Cboe Global Markets, Inc. (CBOE)
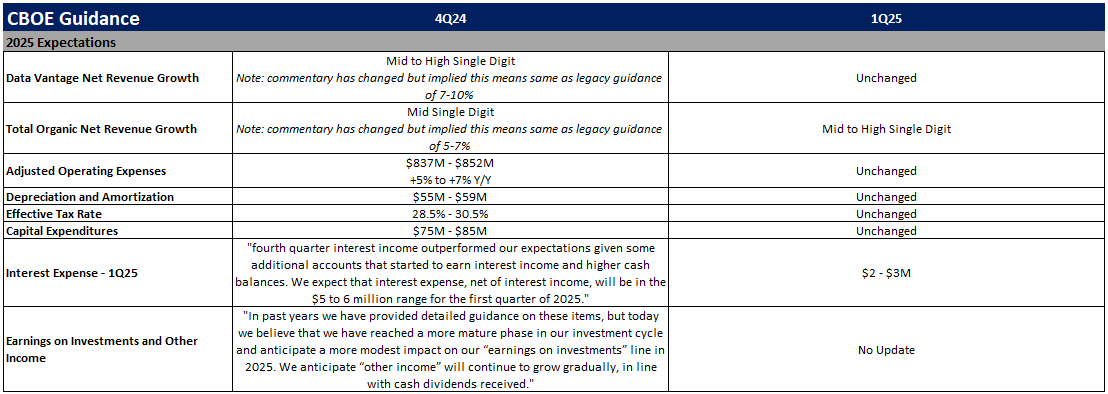
Source: Company documents
Note: CBOE provided additional guidance points / commentary on its 1Q25 earnings call, but key annual highlights are included above for the sake of simplicity
CME Group Inc. (CME)

Source: Company documents
Note: CME provided additional guidance points / commentary on its 1Q25 earnings call, but key annual highlights are included above for the sake of simplicity
Intercontinental Exchange, Inc. (ICE)

Source: Company documents
Note: ICE provided additional guidance points / commentary on its 1Q25 earnings call, but key annual highlights are included above for the sake of simplicity
Nasdaq, Inc. (NDAQ)

Source: Company documents
Note: NDAQ provided additional guidance points / commentary on its 1Q25 earnings call, but key annual highlights are included above for the sake of simplicity
Fixed Income Trading Platforms
MarketAxess Holdings Inc. (MKTX)

Source: Company documents
Note: MKTX provided additional guidance points / commentary on its 1Q25 earnings call, but key annual highlights are included above for the sake of simplicity
Tradeweb Markets Inc. (TW)

Source: Company documents
Note: TW provided additional guidance points / commentary on its 1Q25 earnings call, but key annual highlights are included above for the sake of simplicity
Online Brokers
Robinhood Markets, Inc. (HOOD)

Source: Company documents
Note: HOOD provided additional guidance points / commentary on its 1Q25 earnings call, but key annual highlights are included above for the sake of simplicity
Interactive Brokers Group, Inc. (IBKR)
Source: Company documents
Note: IBKR provided additional guidance points / commentary on its 1Q25 earnings call, but key annual highlights are included above for the sake of simplicity
The Charles Schwab Corporation (SCHW)
