


Weekly Recap for Week Ended April 25, 2025
Weekly Recap of Major Micro / Macro Data Points and Things to Look Forward to in the Week Ahead

Company Specific Updates for Week Ended Apr. 25, 2025
Exchanges
CME Group Inc. (CME)
Reports 1Q25 EPS of $2.80 vs. consensus of $2.81
Revenue missed consensus expectations by 1%
Pre-tax income came in inline with the street
A full recap of CME results is available here
Appoints Vijay Albuquerque as New Chief Risk Officer
Previously served as Head of Counterparty Risk and Portfolio Risk Analytics for Citigroup’s Markets and Banking businesses
Expanding Crypto Derivatives Suite with Launch of XRP Futures
Planned to launch on May 19
Offering micro-sized and larger-sized contracts
Intercontinental Exchange, Inc. (ICE)
National delinquency rate decreased seasonally by -32bps to 3.21%, up 1 bps Y/Y
While serious delinquencies also improved seasonally, they are up 14% (+60K) Y/Y, with the rise driven entirely by FHA delinquencies, which increased by +63K Y/Y
Nasdaq, Inc. (NDAQ)
Reports 1Q25 EPS of $0.79 vs. consensus of $0.77
Revenue inline
Pre-tax income came in 3% above the street
A full recap of NDAQ results is available here
Will position AWS services, exchange and trading participant systems in common location to provide low-latency, high bandwidth connectivity for global applications
Launching Nasdaq Eqlipse, a next gen marketplace technology platform and Nasdaq Eqlipse Intelligence which will unlock full potential of market operators’ data with cloud-based data management, analytics and reporting capabilities
Will be a services deployment model designed to reduce transformation risk and allow market operators to focus technology resources on growth driven capital allocation strategy
Already working with current NDAQ clients, Johannesburg Stock Exchange and Grupo BMV to modernize their ecosystems as well as Nasdaq’s Nordic marketplaces
Fixed Income Trading Platforms
MarketAxess Holdings Inc. (MKTX)
Online Brokers
Robinhood Markets, Inc. (HOOD)
The Charles Schwab Corporation (SCHW)
Extends Partnership With National Youth Development Organization 4-H
SCHW Survey: Women Investors Strike a Disciplined Balance Between Patience and Risk
Declares common stock dividend of $0.27 (unchanged and previously known)
Note: Within the company guidance tracker section of this post, CME and NDAQ guidance tables have been updated to reflect commentary from this week’s earnings calls.
Company Specific Updates Anticipated for the Upcoming Week (Ended May 2, 2025)
Exchanges
Cboe Global Markets, Inc. (CBOE)
1Q25 Earnings Release – Friday, May 2, pre-market
CME Group Inc. (CME)
Apr. Volume Release – Friday, May 2, pre-market
Nasdaq, Inc. (NDAQ)
Apr. Volume Release – Friday, May 2, post-close
Intercontinental Exchange, Inc. (ICE)
1Q25 Earnings Release – Thursday, May 1, pre-market
Fixed Income Trading Platforms
Tradeweb Markets Inc. (TW)
1Q25 Earnings Release – Wednesday, Apr. 30, pre-market
Online Brokers
Robinhood Markets, Inc. (HOOD)
1Q25 Earnings Release – Wednesday, Apr. 30, post-close
Next Four Weeks Calendar

Source: Company press releases and my estimates around timing
Major Macro Updates for Week Ended Apr. 25, 2025
U.S. Leading Economic Indicators (Mar.) – (0.7%) vs. consensus (0.5%) and prior (0.2%)
S&P Flash U.S. Services PMI (Apr.) – 51.4 vs. consensus 52.8 and prior 54.4
S&P Flash U.S. Manufacturing PMI (Apr.) – 50.7 vs. consensus 49.5 and prior 50.2
New Home Sales (Mar.) – 724k vs. consensus 685k and prior 674k
Initial jobless claims (week ended Apr. 19) – 222K vs. consensus 220k and prior 216k
Durable Goods Orders (Mar.) – 9.2% vs. consensus 1.6% and prior 0.9%
Core Durable Orders (Mar.) – 0.1% vs. prior (0.3%)
Existing Home Sales (Mar.) – 4.02M vs. consensus 4.13M and prior 4.27M
Final Consumer Sentiment (Apr.) – 52.2 vs. consensus 50.8 and prior 50.8
Major Macro Updates Scheduled for the Upcoming Week (Ended May 2, 2025)
Monday, Apr. 28
None to Note
Tuesday, Apr. 29
Advanced U.S. Trade Balance in Goods (Mar.) – prior $147.8B
Advanced Retail Inventories (Mar.) – prior 0.1%
Advanced Wholesale Inventories (Mar.) – prior 0.3%
S&P Case-Shiller Home Price Index (Feb.) – prior 4.7%
Consumer Confidence (Apr.) – consensus 87.7 and prior 92.9
Job Openings (Mar.) – consensus 7.4M and prior 7.6M
Wednesday, Apr. 30
ADP Employment (Apr.) – consensus 110k andprior 155k
GDP (2Q) – consensus 0.4% and prior 2.4%
Personal Income (Mar.) – consensus 0.4% and prior 0.8%
Consumer Spending (Mar.) – consensus 0.5% and prior 0.4%
PCE Index (Mar.) – consensus 0.0% and prior 0.3%
PCE Y/Y (Mar.) – consensus 2.2% and prior 2.5%
Core PCE Index (Mar.) – consensus 0.1% and prior 0.4%
Core PCE Y/Y (Mar.) – consensus 2.5% and prior 2.8%
Employment Cost Index (1Q) – consensus 1.0% and prior 0.9%
Chicago Business Barometer (Apr.) – consensus 45.5 and prior 47.6
Pending Home Sales (Mar.) – consensus 1% and prior 2%
Thursday, May 1
Initial jobless claims (week ended Apr. 26) – consensus 226k and prior 222k
ISM Manufacturing (Apr.) – consensus 47.8 and prior 49.0
Construction Spending (Mar.) – consensus 0.3% and prior 0.7%
S&P Final U.S. Manufacturing PMI (Apr.) – prior 50.7
Auto Sales (Apr.) – prior 17.2%
Friday, May 2
Nonfarm Payrolls (Apr.) – consensus 130k and prior 228k
U.S. Unemployment Rate (Apr.) – consensus 4.2% and prior 4.2%
U.S. Hourly Wages (Apr.) – consensus 0.3% and prior 0.3%
Hourly Wages Y/Y (Apr.) – prior 3.8%
Factory Orders (Mar.) – consensus 3.4% and prior 0.6%
Exchange Volume Update
Exchange Volumes Over Past Week and W/W Trends
For the week ended April 25, 2025, volatility generally cooled though volumes were mixed W/W and remained elevated relative to historicals.
The average VIX for the week was down 7% from the prior week, average realized volatility remained heightened and was up 4% W/W, average volatility of volatility (as measured by the VVIX) was down 8% W/W and the average MOVE index (U.S. Treasuries volatility) was down 6% W/W.
Futures average daily volumes (ADV) were mixed as CBOE futures volumes were down 28% W/W, CME futures volumes were down 1% W/W, and ICE futures volumes were up 5% W/W.
Total U.S. Equities ADV was down 4% W/W, mainly driven by on-exchange trading as TRF volumes were down 3% W/W. Industry equity options volumes were up 1% W/W while index options volumes declined 2% W/W.
For further detail on weekly volume trends by exchange and by product line please see the charts below.
CME Futures Volumes (M)
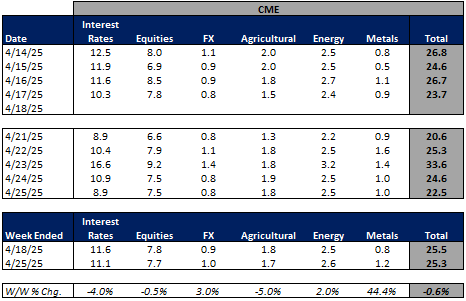
Source: Company Daily Volume Releases
ICE Futures (M), U.S. Equities (B) and U.S. Equity Options (M) Volumes

Source: Company Daily Volume Releases, Cboe Global Markets and OCC
CBOE Options (M), Futures (K), U.S. Equity (B), and FX Volumes ($B)
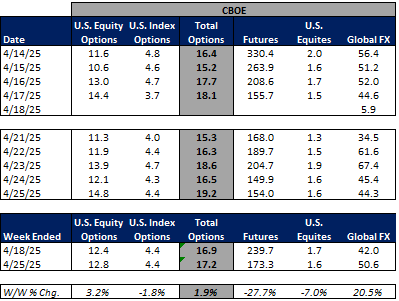
Source: Company Daily Volume Releases and OCC
NDAQ U.S. Equity (B) and Option (M) Volumes
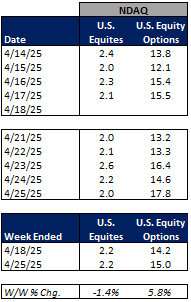
Source: Cboe Global Markets and OCC
U.S. Total Industry Equity Volumes (B)

Source: Cboe Global Markets
U.S. Total Industry Equity Option and Index Option Volumes (M)

Source: OCC
Volatility Metrics

Source: Yahoo Finance
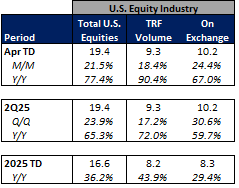
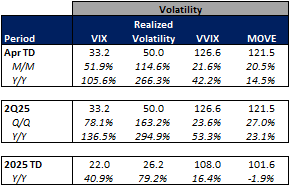
Exchange Volumes MTD / QTD / YTD Trends
Exchange volumes are tracking higher in April-to-date. This comes as volatility is up significantly MTD on a Y/Y basis.
The average VIX in April-to-date is up 106% Y/Y while realized volatility is up 266% Y/Y and volatility of volatility is up 42% Y/Y. Treasuries volatility is higher as well Y/Y as the average MOVE index in April-to-date is up 15% Y/Y.
Futures volumes are higher Y/Y as ICE futures MTD ADV is up 49% vs. April 2024 ADV. Meanwhile, CME ADV is up 42% Y/Y while CBOE futures ADV is up 8% Y/Y.
In terms of equities and options volumes, total U.S. equities ADV is up 77% MTD while option volumes are up 37% for equity options and up 20% for index options.
For further details on MTD / QTD and YTD ADV please see the charts below.
CME Futures Volumes (M)

Source: Company Daily Volume Releases
ICE Futures (M), U.S. Equities (B) and U.S. Equity Options (M) Volumes
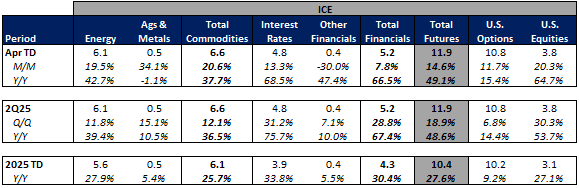
Source: Company Daily Volume Releases, Cboe Global Markets and OCC
CBOE Options (M), Futures (K), U.S. Equity (B), and FX Volumes ($B)
Source: Company Daily Volume Releases and OCC
NDAQ U.S. Equity (B) and Option (M) Volumes
Source: Cboe Global Markets and OCC
U.S. Total Industry Equity Volumes (B)
Source: Cboe Global Markets
U.S. Total Industry Equity Option and Index Option Volumes (M)

Source: OCC
Volatility Metrics
Source: Yahoo Finance
Major Indices, Interest Rates and Company Share Price Trends
This week was a bit calmer than we’ve seen the past couple weeks with all of the trade war headlines hitting the tape. Ultimately, the market closed the week out up 460bps as earnings season really got into full swing and the market took a moment to digest the trade war news and potential implications for the broader economy.
In terms of the companies I follow, the online brokers shows the best performance up 5%-20% W/W. The exchanges performed mixed, with CBOE down 1.6% W/W while NDAQ rose 4.4%. Fixed income trading land was mixed as well with MKTX falling 2.7% and TW up 0.7%.

Source: Yahoo Finance, FRED, U.S. Department of the Treasury
Comp Sheet
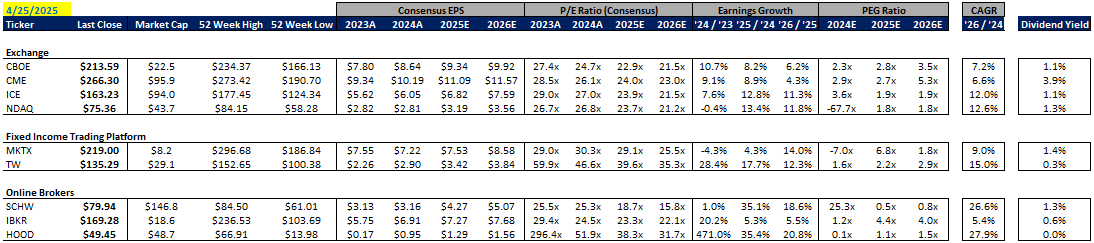
Source: PitchBook
Guidance Tracker
Exchanges
Cboe Global Markets, Inc. (CBOE)

Source: Company documents
Note: CBOE provided additional guidance points / commentary on its 4Q24 earnings call, but key annual highlights are included above for the sake of simplicity
CME Group Inc. (CME)

Source: Company documents
Note: CME provided additional guidance points / commentary on its 1Q25 earnings call, but key annual highlights are included above for the sake of simplicity
Intercontinental Exchange, Inc. (ICE)

Source: Company documents
Note: ICE provided additional guidance points / commentary on its 4Q24 earnings call, but key annual highlights are included above for the sake of simplicity
Nasdaq, Inc. (NDAQ)

Source: Company documents
Note: NDAQ provided additional guidance points / commentary on its 1Q25 earnings call, but key annual highlights are included above for the sake of simplicity
Fixed Income Trading Platforms
MarketAxess Holdings Inc. (MKTX)

Source: Company documents
Note: MKTX provided additional guidance points / commentary on its 4Q24 earnings call, but key annual highlights are included above for the sake of simplicity
Tradeweb Markets Inc. (TW)

Source: Company documents
Note: TW provided additional guidance points / commentary on its 4Q24 earnings call, but key annual highlights are included above for the sake of simplicity
Online Brokers
Interactive Brokers Group, Inc. (IBKR)
Source: Company documents
Note: IBKR provided additional guidance points / commentary on its 1Q25 earnings call, but key annual highlights are included above for the sake of simplicity
The Charles Schwab Corporation (SCHW)
