


March Exchange Volumes – Volatility and Volumes Substantially Higher Y/Y; 1Q Volume Trends Show Upside to EPS Estimates
Monthly Recap of Exchange Volumes for March and EPS Impacts for the Exchanges

In March, average volatility metrics increased as tariff driven volatility drove markets in the month while volumes across the exchange landscape showed mixed results. While March results were mixed, exchange volumes mainly increased for the quarter both Q/Q and Y/Y, which should lead to increased transaction-based revenues across the exchange landscape. Based on current QTD volume trends, I currently see 2% to 11% upside to exchange EPS estimates for the quarter with CBOE showing the strongest volume results (implying 11% EPS upside for the quarter) and NDAQ showing the least amount of upside at 2% (which makes sense given NDAQ’s de-emphasis on transaction based revenue streams). Over the coming days, the exchanges should all report official volume results and I would expect an upward bias to sell-side revenue estimates for the quarter given where volumes ended up shaking out.

Source: company documents and my estimates
Industry Wide Volume Recap
Volatility
Average volatility was higher in March relative to February’s averages as the VIX was up 28% M/M, realized volatility (measured by the daily changes in the S&P 500) was up 59% M/M, volatility of volatility (as measured by the VVIX) was up 4% M/M and treasury volatility (as measured by the MOVE index) was up 11% M/M. Relative to a year ago, average volatility was higher as well in March with the VIX up 58% Y/Y, realized volatility up 68% Y/Y, the VVIX up 27% Y/Y and the MOVE index up 2% Y/Y.
Through quarter-end, volatility was mixed relative to 4Q24 but mainly higher than the year ago quarter. The average VIX for the full quarter of 18.6 was up 7% Q/Q (+36% Y/Y), while realized volatility averaged 19.0 (+38% Q/Q, +39% Y/Y), the VVIX averaged 102.4 (down less than 1% Q/Q, +24% Y/Y) and the MOVE index averaged 95.7 (-8% Q/Q, -10% Y/Y).
Average volatility levels can generally be indicative of trading activity with volumes generally increasing in periods of heightened volatility and decreasing as volatility subsides.
13 Month Trailing Volatility Metrics

Source: Yahoo Finance
U.S. Equities
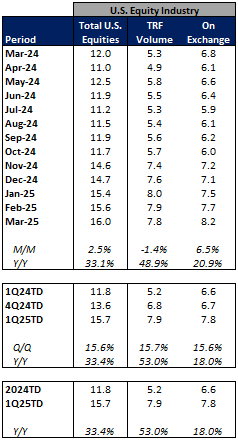
Average U.S. cash equities volumes (ADV) were up slightly M/M in March at 16.0 billion shares traded per day but increased 33% Y/Y. The Y/Y increase was primarily driven by off-exchange volumes (Trade Reporting Facility or TRF Volume) as TRF volumes were up 49% Y/Y (down 1% M/M) to 7.8 billion traded per day while on-exchange volumes were up 21% Y/Y (+7% M/M) to 8.2 billion traded per day. This marks the first month since October 2024 where on-exchange activity exceeded that of TRF trading volumes.
Through quarter-end, U.S. equity ADV was higher both sequentially and year over year as volumes averaged 15.7 billion shares traded per day (+16% Q/Q, +33% Y/Y). Full quarter growth was driven by both off-exchange volumes with TRF ADV of 7.9 billion (+16% Q/Q, +53% Y/Y) and on-exchange volumes are averaging 7.8 billion shares per day (+16% Q/Q, +18% Y/Y).
13 Month Trailing Average Daily U.S. Cash Equities Volumes
Source: Cboe Global Markets
In terms of market share of U.S. cash equities volumes, the big three publicly traded U.S. exchange groups (CBOE, ICE, NDAQ) showed mixed market share in March relative to February levels but all three showed substantial Y/Y declines in market share in March. CBOE posted market share of 10.1% in March (-61 bps M/M, -207 bps Y/Y), ICE posted market share of 19.5% in March (+169 bps M/M, -164 bps Y/Y) and NDAQ posted market share of 15.3% (+90 bps M/M, -129 bps Y/Y).
For the quarter, CBOE market share averaged 10.4%, (-23 bps Q/Q, -237 bps Y/Y), ICE averaged 18.3% (+14 bps Q/Q, -205 bps Y/Y) and NDAQ averaged 14.6% (+19 bps Q/Q, -165 bps Y/Y).
13 Month Trailing U.S. Cash Equities Market Share

Source: Cboe Global Markets
13 Month Trailing U.S. Cash Equities Market Share

Source: Cboe Global Markets
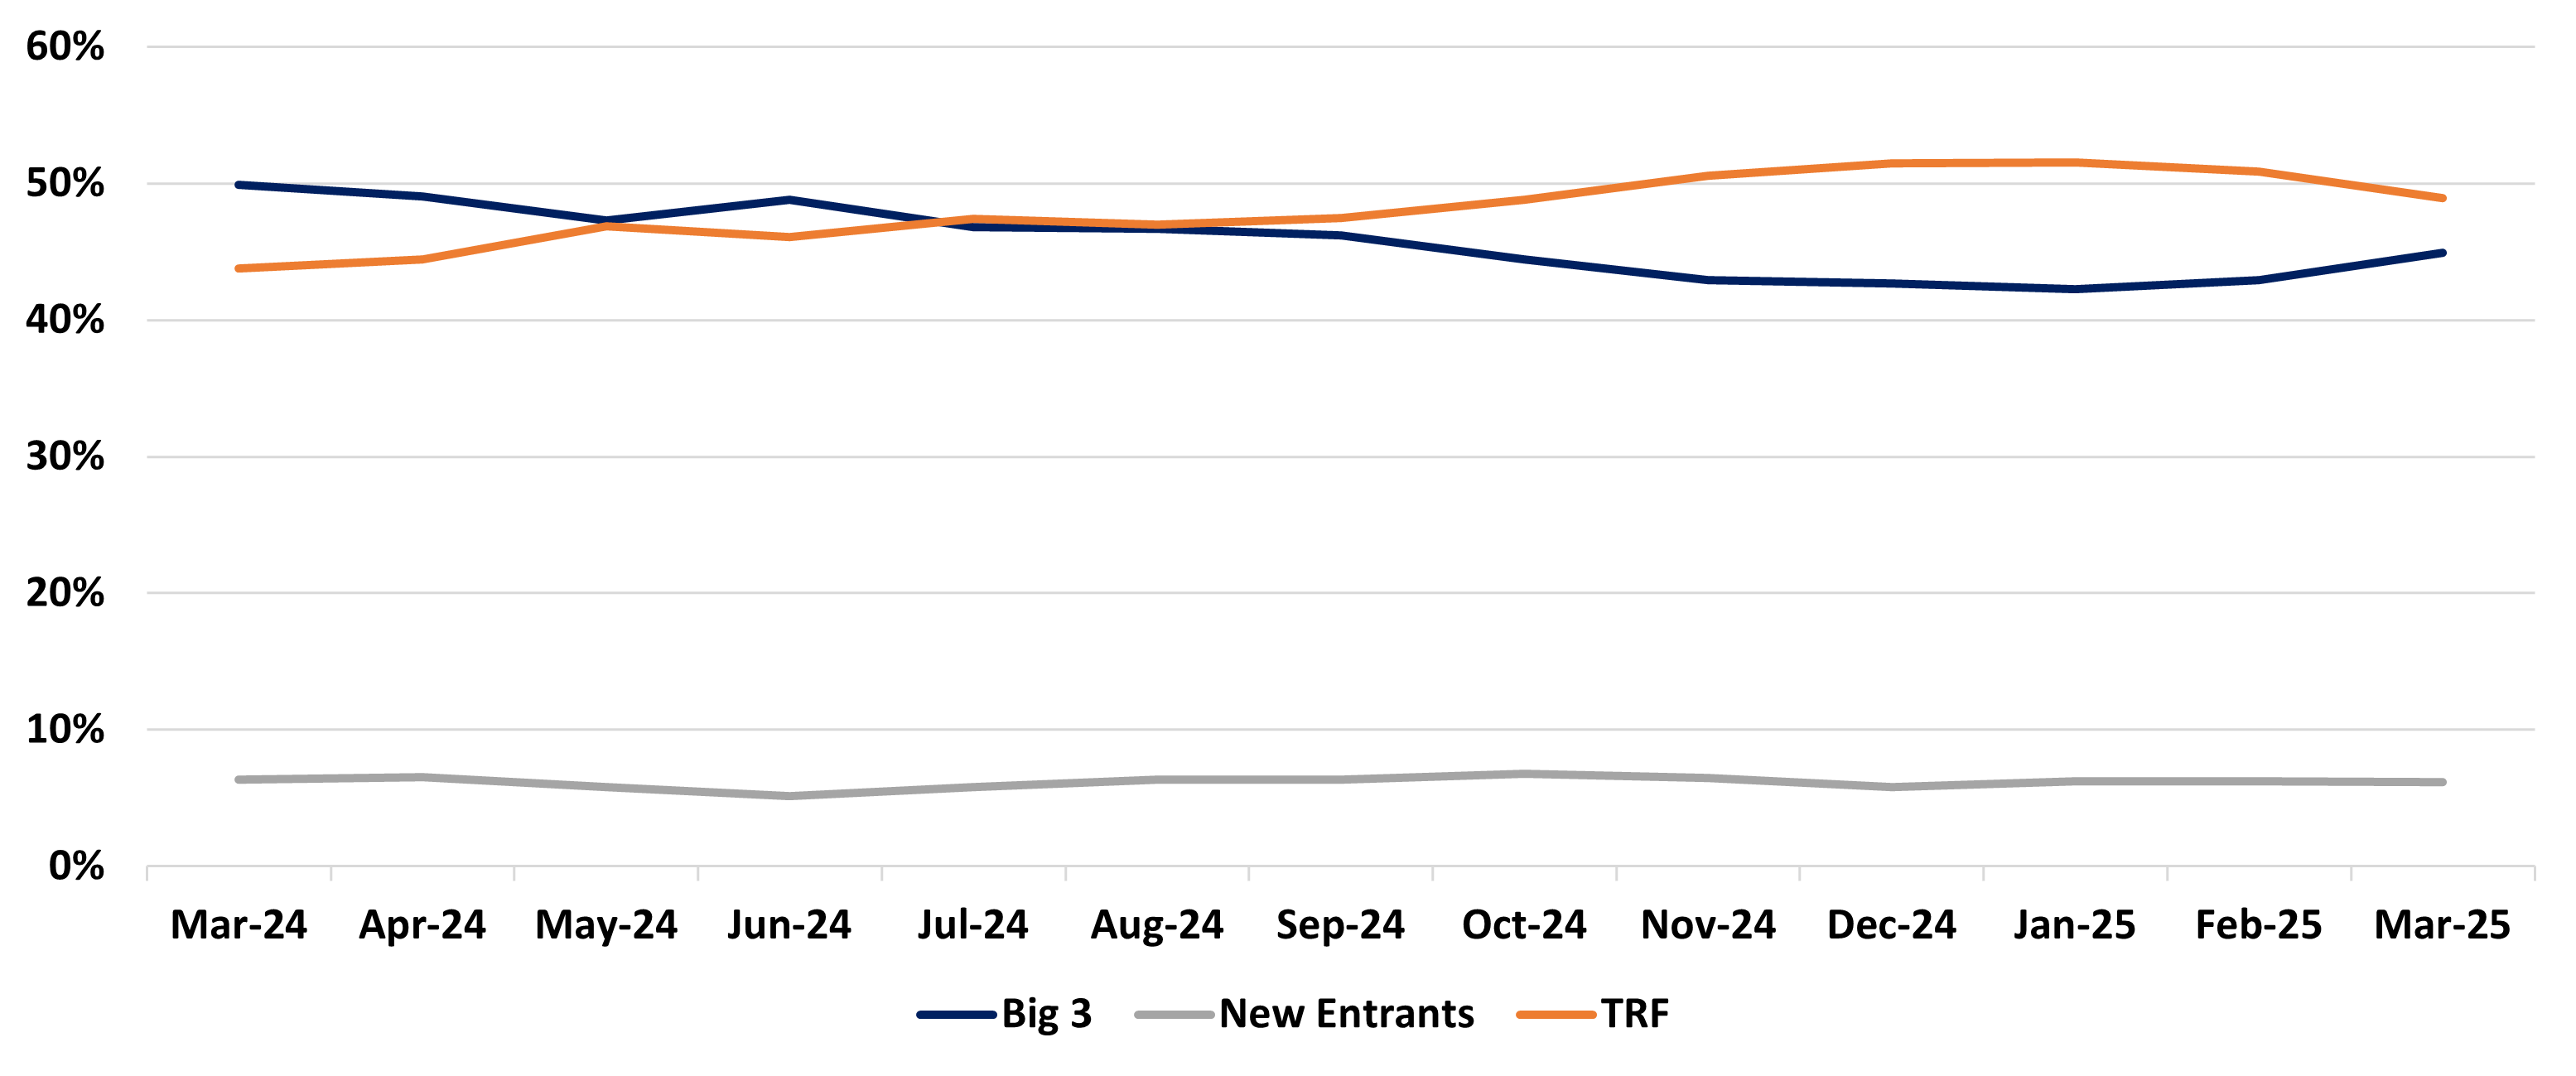
As we can see in the graph below, off-exchange volumes surpassed that of the combined market share of the big 3 publicly traded exchanges in July of 2024 and have continued to remain elevated since. This phenomenon explains why there have been a number of references to the level of off-exchange trading in recent weeks and the potential implications for market structure and market quality in the U.S. and which I referenced in my weekly write-up a few weeks back (Links: Bloomberg Article on Off-Exchange Trading, Nasdaq 4Q24 earnings presentation showing market share excluding off-exchange volumes, Nasdaq blog post on off-exchange trading increasing across all types of stocks).
13 Month Trailing U.S. Cash Equities Market Share
Source: Cboe Global Markets
U.S. Options, Index Options and OCC Futures Volumes
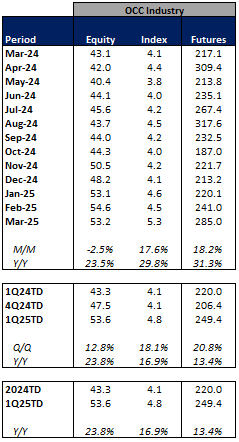
Average U.S. equity options volumes were down 3% M/M in March to 53.2 million contracts traded per day but increased 24% Y/Y. Meanwhile Index option volumes were up 18% M/M in March to 5.3 million contracts per day (+30% Y/Y) and OCC Futures volumes increased 18% M/M in March to 285k contracts per day (+31% Y/Y).
For the quarter, U.S. equity options ADV was higher both sequentially and year over year as volumes averaged 53.6 million contracts traded per day (+13% Q/Q, +24% Y/Y). Index options volumes averaged 4.8 million contracts per day (+18% Q/Q, +17% Y/Y) while OCC Futures volumes averaged 249k per day (+21% Q/Q, +13% Y/Y).
13 Month Trailing Average Daily U.S. Equity Options, Index and OCC Futures Volumes
Source: OCC
In terms of market share of U.S. equity options volumes, the big three publicly traded U.S. exchange groups (CBOE, ICE, NDAQ) showed mixed results in March relative to February and year ago levels. CBOE posted market share of 24.8% in March (+59 bps M/M, -89 bps Y/Y), ICE posted market share of 18.1% in March (-60 bps M/M, -424 bps Y/Y) and NDAQ posted market share of 29.3% (-29 bps M/M, +47 bps Y/Y).
For the quarter, CBOE market share averaged 25.0%, (+55 bps Q/Q, +21 bps Y/Y), ICE averaged 18.8% (-15 bps Q/Q, -272 bps Y/Y) and NDAQ averaged 29.1% (-119 bps Q/Q, -18 bps Y/Y).
13 Month Trailing U.S. Equity Options Market Share

Source: OCC
13 Month Trailing U.S. Equity Options Market Share
Source: OCC
Company Specific Updates
Cboe Global Markets, Inc. (CBOE)
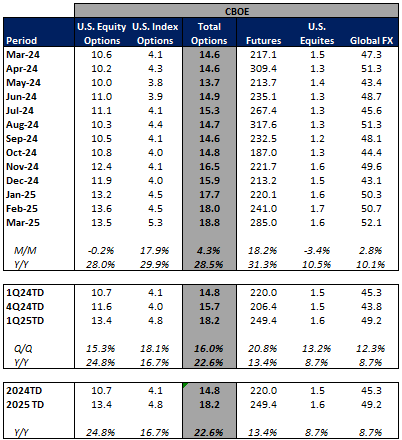
CBOE 0.00%↑ volumes ended March mixed as equity options and U.S. equity volumes declined vs. February levels while index options, futures and FX volumes increased M/M. U.S. cash equities ADV at CBOE was 1.6 billion for the month, down 3% M/M (+11% Y/Y), and equity options volumes at CBOE averaged 13.5 million per day (down less than 1% M/M, +28% Y/Y). Index options ADV came in at 5.3 million in March (+18% M/M, +30% Y/Y), futures volumes ended March at 285k per day (+18% M/M, +31% Y/Y) and Global FX volumes ended the month at $52.1 billion per day (+3% M/M, +10% Y/Y).
For the quarter, volumes across the board ended higher both sequentially and year over year. U.S. equity options ADV came in at 13.4 million (+15% Q/Q, +25% Y/Y), Index options ADV ended the quarter at 4.8 million (+18% Q/Q, +17% Y/Y), futures volumes came in at 249k (+21% Q/Q, +13% Y/Y), U.S. equities ADV ended the quarter at 1.6 billion and Global FX ADNV finished at $49.2 billion (+12% Q/Q, +9% Y/Y).
CBOE Key Product Lines Trailing 13 Month ADV
Source: Cboe Global Markets and OCC
In terms of the revenue and EPS impact from the above volume statistics for CBOE, relative to last quarter’s results I see about $34 million in revenue upside to CBOE’s transaction based revenues for 1Q25. This translates into about $0.23 in EPS, or 11% upside relative to what CBOE reported last quarter.

Source: company documents and my estimates
CME Group Inc. (CME)
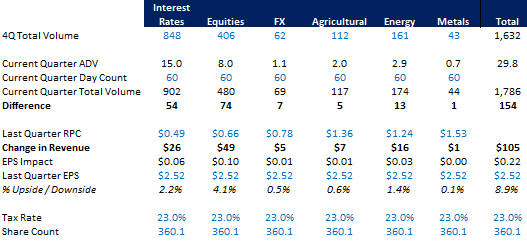
CME 0.00%↑ total volumes ended March up Y/Y but declined sequentially. Total CME ADV declined 7% M/M to 30.8 million contracts per day (+27% Y/Y). Interest rates ADV seasonally declined to 14.6 million per day (-24% M/M, +31% Y/Y), metals ADV fell to 0.7 million (-8% M/M, -10% Y/Y), Ags ADV decreased to 1.8 million (-12% M/M, +20% Y/Y), FX ADV increased to 1.4 million (+27% M/M, +12% Y/Y), energy ADV declined to 2.6 million (-6% M/M, +21% Y/Y) and equities ADV increased to 9.7 million (+34% M/M, +31% Y/Y). Note that interest rates ADV typically decreases dramatically in the third month of the quarter as quarterly rate contracts expired during month two causing an increase in roll over activity.
For the quarter total CME volumes averaged 29.8 million per day (+17% Q/Q, +13% Y/Y). By contract type, Energy ADV increased to 2.9 million per day (+15% Q/Q, +20% Y/Y), FX ADV increased to 1.1 million per day (+19% Q/Q, +17% Y/Y), equities ADV increased to 8.0 million per day (+26% Q/Q, +17% Y/Y), Ags ADV increased to 2.0 million per day (+12% Q/Q, +23% Y/Y), metals ADV increased to 0.7 million per day (+9% Y/Y) and interest rates ADV increased to 15.0 million per day (+14% Q/Q, +9% Y/Y).
CME Key Product Lines Trailing 13 Month ADV

Source: CME Group Inc.
In terms of the revenue and EPS impact from the above volume statistics for CME, relative to last quarter’s results I see about $105 million in revenue upside to CME’s transaction based revenues for 1Q25. This translates into about $0.22 in EPS, or 9% upside relative to what CME reported last quarter.
Source: company documents and my estimates
Intercontinental Exchange, Inc. (ICE)
ICE 0.00%↑ volumes were mixed M/M in March but were mainly higher Y/Y. Total futures ADV increased to 10.3 million (+7% M/M, +31% Y/Y) as energy ADV declined to 5.1 million (-8% M/M, +24% Y/Y), interest rate ADV increased to 4.2 million (+28% M/M, +55% Y/Y) and other financials ADV increased to 0.6 million (+111% M/M, +7% Y/Y) while ags & metals ADV declined to 0.4 million per day (-28% M/M, -13% Y/Y). U.S. options volumes declined to 9.6 million per day (-6% M/M, unchanged Y/Y) while U.S. equities volumes increased to 3.1 billion per day (+10% M/M, +21% Y/Y).
For the quarter, ICE’s volumes were generally higher both Q/Q and Y/Y with total futures ADV increasing to 10.0 million per day (+17% Q/Q, +23% Y/Y), U.S. options increasing to 10.1 million per day (+12% Q/Q, +8% Y/Y) and U.S. equities ADV increasing to 2.9 billion per day (+17% Q/Q, +18% Y/Y).
ICE Key Product Lines Trailing 13 Month ADV

Source: Intercontinental Exchange, Inc., Cboe Global Markets and OCC
In terms of the revenue and EPS impact from the above volume statistics for ICE, relative to last quarter’s results I see about $104 million in revenue upside to ICE’s transaction-based revenues for 1Q25. This translates into about $0.14 in EPS, or 9% upside relative to what ICE reported last quarter.

Source: company documents and my estimates
Nasdaq, Inc. (NDAQ)
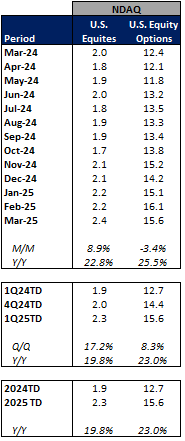
NDAQ 0.00%↑ volumes were mixed M/M but increased Y/Y in March. U.S. equities ADV increased to 2.4 billion (+9% M/M, +23% Y/Y) while U.S. equity options ADV declined to 15.6 million (-3% M/M, +26% Y/Y).
For the full quarter, NDAQ volumes increased sequentially and Y/Y. U.S. equities ADV finished at 2.3 billion (+17% Q/Q, +20% Y/Y) and U.S. options ADV increased to 15.6 million (+8% Q/Q, +23% Y/Y).
NDAQ Key Product Lines Trailing 13 Month ADV
Source: Cboe Global Markets and OCC
In terms of the revenue and EPS impact from the above volume statistics for NDAQ, relative to last quarter’s results I see about $10 million in revenue upside to NDAQ’s transaction based revenues for 1Q25. This translates into about $0.01 in EPS, or 2% upside relative to what NDAQ reported last quarter.
