


Weekly Recap for Week Ended January 31, 2025
Weekly Recap of Major Micro / Macro Data Points and Things to Look Forward to in the Week Ahead

Significant News / Developments from Week Ended Jan. 31, 2025
Exchanges
Off-Exchange Trading Volume Now Makes up >50% of U.S. Equities Volume (Bloomberg)
On Friday, January 24 Bloomberg published an article noting that over 50% of U.S. equity volume is now taking place off-exchange for the first time in history. While this article technically hit the tape in time for last week’s weekly update, it has continued to generate a decent amount of attention over this past past week, thus I figured it was relevant to include in today’s update. The article included a similar version of the graph below, which is a wild depiction of where U.S. equity shares are traded on average monthly:
Mix of U.S. Equity Share Volume Traded On-Exchange vs. Off-Exchange

Source: Cboe Global Markets
This has generated a lot of discourse in recent days, because it brings up questions about price discovery and quality in U.S. equity markets (as more volume moves off lit venues, that must disclose a best bid and offer, the assumption is that the quality of price discovery declines).
Nasdaq (NDAQ 0.00%↑) even pointed to this trend in its 4Q24 earnings results as the company explicitly published market share statistics in U.S. equities both including and excluding off-exchange volume. Market share of total U.S. equity market volume in 4Q24, including off-exchange trading came in at 14.4% while market share of just on-exchange trading volume was 29.0%. Nasdaq also noted that this shift in volumes off-exchange provided a bit of a headwind to its Market Services business’ revenue growth: “The strong quarterly net revenue growth benefited from an increase in U.S. derivatives revenue primarily due to record volumes and strong index options revenue growth, higher U.S. cash equities revenue from higher volume capture and market share of available on exchange trading volume, as well as higher capture in European cash equities and derivatives. With these factors partially offset by a market-wide shift of U.S. cash equity volumes off-exchange …” (italics my own emphasis).
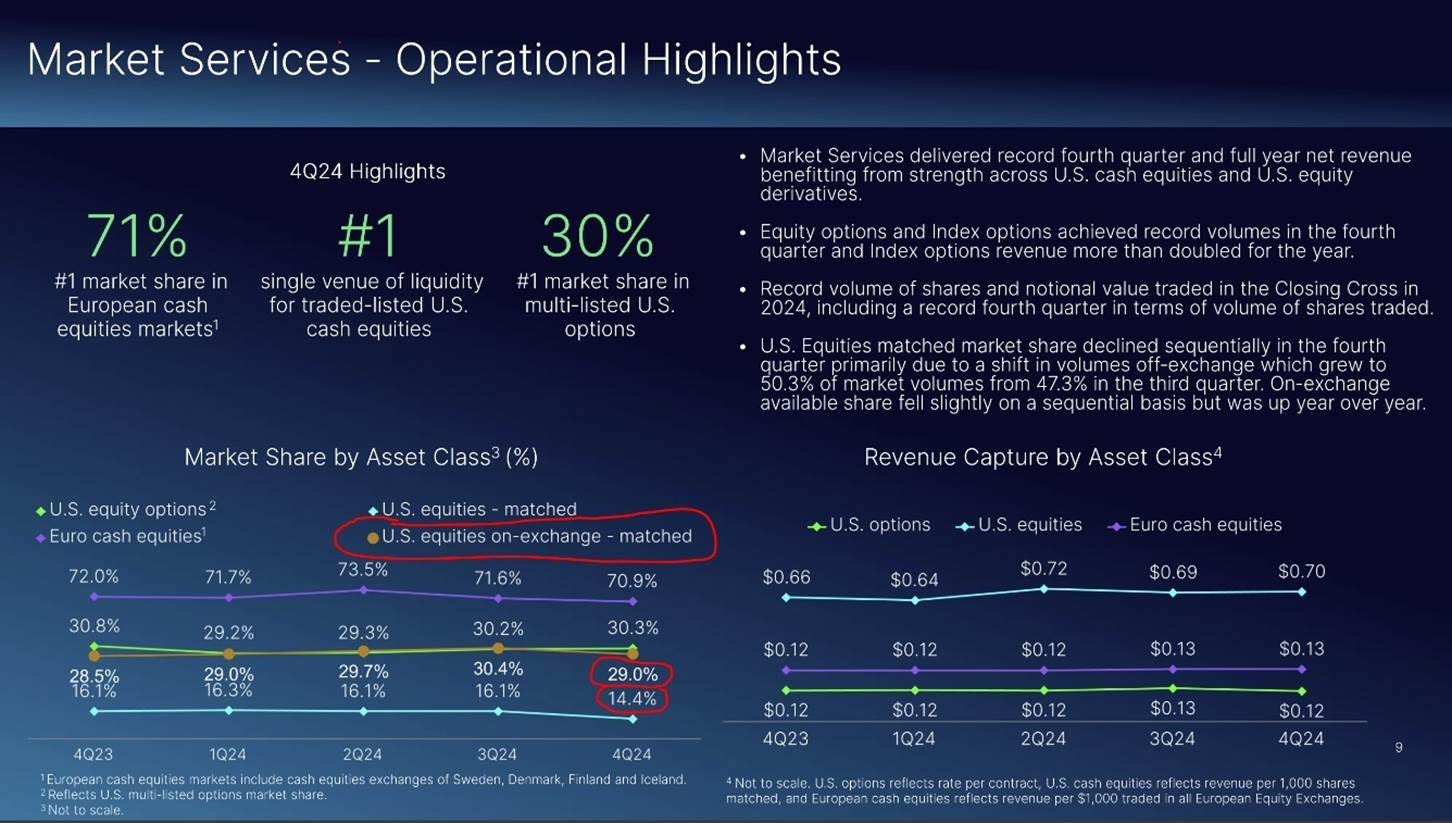
Source: NDAQ 4Q24 Earnings Presentation
What’s interesting is that, while not always the case, during periodic spikes in volatility, on-exchange trading activity typically picks up. Looking back over the past 9 years there have been 97 days when the VIX spikes 15%+ versus the prior day’s level. On 77 of these 97 occasions there has been an increase in the percentage of on-exchange trading volume versus the prior day, with an average increase of 1.1 percentage points, a median increase of 1.1 percentage points and a max increase of 6.1 percentage points. So, while the longer-term trend has been a shift away from lit venue trading to off-exchange trading, the nationally licensed exchanges absolutely provide a service for market participants. Furthermore, on-exchange volumes naturally increase during the opening and closing cross as the listings venues form an opening and closing auction price for each listed security. However, I do think market participants’ concerns are valid and something likely needs to occur to address price discovery / transparency concerns given the rise in off-exchange trading broadly.
On Exchange Volume Mix Increase or Decrease Day / Day vs. VIX Day / Day % Change.

Source: Cboe Global Markets and Yahoo Finance
Note: Period covers January 2016 through January 2025. Days shown only include days when VIX spikes 15% or more vs. the prior trading day.
FT Article on 24-Hour Trading
On Thursday, January 30, the Financial Times published an article discussing the New York Stock Exchange’s proposal to extend trading hours on its NYSE Arca exchange to 22 hours a day, with the trading day taking place from 1:30am to 11:30pm Eastern Time. Intercontinental Exchange (ICE) originally announced this proposal back in October, 2024 but the FT piece discussed some of the challenges the industry may face if licensed stock exchanges actually transition closer to a 24-hour trading day. These concerns include: 1) at what time does a stock actually close (as this becomes a reference price for funds)?, 2) how do large institutions manage overnight risk during (likely) thinner periods of liquidity?, 3) are overnight trading rules going to be different than daytime trading rules?, amongst a multitude of other concerns that could impact the already complex U.S. equity market structure.
In my view all these concerns are extremely valid and need to be considered carefully and addressed by regulators and the industry broadly. Further, I think these concerns need to be addressed relatively quickly as trading already occurs in overnight hours for retail traders across select ETFs and company shares – Schwab, Interactive Brokers and Robinhood already offer overnight trading to clients with after-hours trades typically occurring in off-exchange venues. Thus, I feel that the industry will need to meet demand where it is and ICE 0.00%↑’s extended trading plan will likely be approved, but there are very serious concerns to address before launch.
Company Specific Updates for Week Ended Jan. 31, 2025
Exchanges
Nasdaq, Inc. (NDAQ)
Reported 4Q24 EPS of $0.76 vs. consensus of $0.75.
Revenues inline with expectations
Growth in FinTech segment was a bit softer than medium term guide
Financial Crime Management revenues solid
A bit softer in Regulatory Technology and Capital Markets Technology reported revenue, but ARR growth for these two was strong (high single / low double digit range)
Capital Access Platforms revenue growth toward high end of medium term guide
Driven by continued strength in Index (+29% Y/Y)
Data and Listings starting to show growth again
Workflow and Insights remains soft
Expense guide implies expenses +5.7% Y/Y at midpoint
Slightly higher than I was expecting – would have thought at or below the low end of medium-term range (5-8%) given Adenza synergies
However, noted anticipated actioning additional cost savings (upped expense savings expectation to $140M from the $80M actioned in 2024) that will flow into 2026
Overall revenue outlook for 2025 inline with medium-term guidance range with some puts and takes (see full guidance tracker toward the bottom of this post for a complete rundown of NDAQ guidance points)
All in all a decent quarter – stock ended up 67bps on the day
My initial reaction was the stock should be down after the expense guide but after further analysis of the quarter I think where it ended the day Wednesday is about right
Euronext to acquire Nasdaq’s Nordic power futures business
No financial terms disclosed
Migration of futures trading and open positions anticipated in 1H26
Intercontinental Exchange, Inc. (ICE)
CME Group Inc. (CME)
Fixed Income Trading Platforms
MarketAxess Holdings Inc. (MKTX)
Tradeweb Markets Inc. (TW)
Online Brokers
The Charles Schwab Corporation (SCHW)
Robinhood Markets, Inc. (HOOD)
Company Specific Updates Anticipated for the Upcoming Week (Ended Feb. 7, 2025)
Exchanges
ICE
4Q24 EPS Expected Thursday, Feb. 6 (pre-market) – Consensus expects EPS $1.49 on Revenue of $2.32B
January volume release expected Wednesday, Feb. 5 (pre-market)
Cboe Global Markets, Inc. (CBOE)
4Q24 EPS Expected Friday, Feb. 7 (pre-market) – Consensus expects EPS $2.12 on Revenue of $527M
January volume release expected Wednesday, Feb. 5 (post-close)
CME
January volume release expected Tuesday, Feb. 4 (pre-market)
NDAQ
January volume release expected Tuesday, Feb. 4 (post-close)
Fixed Income Trading Platforms
TW
4Q24 EPS Expected Thursday, Feb. 6 (pre-market) – Consensus expects EPS $0.74 on Revenue of $458M
January volume release expected Thursday, Feb. 6 (pre-market)
MKTX
4Q24 EPS Expected Thursday, Feb. 6 (pre-market) – Consensus expects EPS $1.69 on Revenue of $203M
January volume release expected Wednesday, Feb. 5 (pre-market)
Online Brokers
Interactive Brokers Group, Inc. (IBKR)
January metrics release expected Monday, Feb. 3 (post-close)
Next Four Weeks Calendar

Source: Company press releases and my estimates around timing
Major Macro Updates for Week Ended Jan. 31, 2025
New Home Sales for December – 698k vs. consensus 671k & prior month 674k
Case-Shiller Home Price Index for November – 4.3% vs. consensus 4.3% and prior 4.2%
Consumer confidence for January – 104.1 vs. consensus 106.0 and prior 109.5
FOMC Rate Decision – Fed kept rates on hold as was widely expected
U.S. GDP 4Q24 – 2.3% vs. forecast 2.5% and prior 3.1%
Initial Jobless Claims for Week Ended Jan. 25 – 207k vs. cons. 228k and prior 223k
Pending Home Sales for December – (5.5%) vs. cons. 0.3% and prior 1.6%
PCE Y/Y for December – 2.6% vs. cons. 2.6% and prior 2.5%
Core PCE Y/Y for December – 2.8% vs. cons. 2.8% and prior 2.8%
Major Macro Updates Scheduled for the Upcoming Week (Ended Feb. 7, 2025)
Monday, Feb. 3
Final Manufacturing PMI (Jan.) – previous 50.1
ISM Manufacturing (Jan.) – consensus 50.0, previous 49.3%
Tuesday, Feb. 4
Job Openings (Dec.) – consensus 8.1M, previous 8.1M
Wednesday, Feb. 5
ADP Employment (Jan.) – previous 122k
Final Services PMI (Jan.) – previous 52.8
ISM Services (Jan.) – consensus 54.4%, previous 54.1%
Thursday, Feb. 6
Initial jobless claims (week ended Feb. 1) – consensus 213k, prior 207k
Friday, Feb. 7
U.S. employment report (Jan.) – consensus 175k, prior 256k
U.S. unemployment rate (Jan.) – consensus 4.1%, prior 4.1%
U.S. hourly wages y/y (Jan.) – consensus 3.7%, prior 3.9%
Consumer sentiment (Jan. prelim) – consensus 71.8, prior 71.1
Exchange Volume Update
Exchange Volumes Over Past Week and W/W Trends
For the week ended January 31, 2025, volumes were mixed week over week despite volatility increasing following the DeepSeek driven tech market rout on Monday.
The average VIX for the week was up 11% from the prior week, average realized volatility was flat W/W, average volatility of volatility (as measured by the VVIX) was up 3% W/W and the average MOVE index (U.S. Treasuries volatility) was up 2% W/W.
Futures average daily volumes (ADV) were mixed as CBOE futures volumes were up 29% W/W, CME futures volumes were up 10% W/W (driven by a 28% W/W increase in equity futures) while ICE futures volumes were down 6% W/W.
Total U.S. Equities ADV was up 4% W/W, mainly driven by on-exchange trading as TRF volumes were down 1% W/W. Industry equity options volumes also increased (+10% W/W) while index options volumes declined (-1% W/W).
For further detail on weekly volume trends by exchange and by product line please see the charts below.
CME Futures Volumes (M)

Source: Company Daily Volume Releases
ICE Futures (M), U.S. Equities (B) and U.S. Equity Options (M) Volumes

Source: Company Daily Volume Releases, Cboe Global Markets and OCC
CBOE Options (M), Futures (K), U.S. Equity (B), and FX Volumes ($B)

Source: Company Daily Volume Releases and OCC
NDAQ U.S. Equity (B) and Option (M) Volumes

Source: Cboe Global Markets and OCC
U.S. Total Industry Equity Volumes (B)

Source: Cboe Global Markets
U.S. Total Industry Equity Option and Index Option Volumes (M)

Source: OCC
Volatility Metrics

Source: Yahoo Finance
Exchange Volumes MTD / QTD / YTD Trends
Exchange volumes have started the year on a high note with most products showing Y/Y monthly ADV growth in January-to-date. This comes as volatility is generally higher MTD on a Y/Y basis.
The average VIX in January-to-date is up 25% Y/Y while realized volatility is up 50% Y/Y and volatility of volatility is up 23% Y/Y. Treasuries volatility is lower Y/Y as the average MOVE index in January-to-date is down 14% Y/Y.
Futures volumes are somewhat mixed as ICE futures MTD ADV is up 21% vs. January 2024 ADV. Meanwhile, CME ADV is up 2% Y/Y while CBOE futures ADV is down 4% Y/Y.
In terms of equities and options volumes, total U.S. equities ADV is up 34% MTD while option volumes are up 25% for equity options and 10% for index options.
For further details on MTD / QTD and YTD ADV please see the charts below.
CME Futures Volumes (M)

Source: Company Daily Volume Releases
ICE Futures (M), U.S. Equities (B) and U.S. Equity Options (M) Volumes

Source: Company Daily Volume Releases, Cboe Global Markets and OCC
CBOE Options (M), Futures (K), U.S. Equity (B), and FX Volumes ($B)

Source: Company Daily Volume Releases and OCC
NDAQ U.S. Equity (B) and Option (M) Volumes

Source: Cboe Global Markets and OCC
U.S. Total Industry Equity Volumes (B)

Source: Cboe Global Markets
U.S. Total Industry Equity Option and Index Option Volumes (M)

Source: OCC
Volatility Metrics

Source: Yahoo Finance
Major Indices, Interest Rates and Company Share Price Trends
Markets started the week with a bit of a shock in the wake of DeepSeek news over the weekend of 1/25 & 1/26 which caused a rethink of the amount of spend being pumped into AI and adjacent companies broadly. On Monday the Nasdaq was down 3% while the SPX was down 1.5% and the 10-year yield dropped 10bps as tech names sold off hard and investors broadly chased safe havens following the DeepSeek news. Meanwhile, banks fared well on Monday with the KRE up 1% and BKX up 40bps. Tuesday the markets calmed a bit with a recovery in the Nasdaq and SPX. The big news out on Wednesday was the FOMC January rate decision and press conference. While markets took the FOMC news in stride (only modest market moves Wednesday as the FOMC held rates steady, which was widely expected) I viewed the Chair’s statement as slightly hawkish relative to December’s statement given some modest tweaks to the rhetoric around inflation and the labor market. Thursday and Friday were slightly calmer, though Friday’s PCE report did cause a bit of a market sell-off as inflation remains elevated relative to the Fed’s 2% objective.
In terms of the companies I follow, CBOE performed the best amongst the exchanges as volatility spiked early in the week. Nasdaq was up 1.5% on the week driven by earnings results. After initially selling off following the print on Wednesday, NDAQ ended the day up ~70bps as investors digested the release and outlook for the company’s Solutions businesses. The fixed income trading platforms declined W/W with the 10-year yield coming down a bit. Meanwhile SCHW and HOOD were both up 1-1.5% W/W.

Source: Yahoo Finance, FRED, U.S. Department of the Treasury
Comp Sheet

Source: PitchBook
Guidance Tracker
Exchanges
Nasdaq, Inc. (NDAQ)

Source: Company documents
Note: NDAQ provided additional guidance points / commentary on its 4Q24 earnings call, but key annual highlights are included above for the sake of simplicity
Online Brokers
The Charles Schwab Corporation (SCHW)
