


A Brief Overview of the Exchange Landscape
High Level Overview of the Exchange Space Outlining a Brief History of the Exchanges (CBOE, CME, ICE, NDAQ), Key Business Lines, Revenue Mix and Valuation History

An Extremely Condensed History of the Exchange Businesses in the United States
Modern financial markets can trace their history back to the creation of the Amsterdam stock exchange in 1602, which is widely regarded as the world’s oldest securities market and the first to generate significant secondary trading liquidity in equity securities. Within the United States, the New York Stock Exchange, the oldest incarnation of today’s publicly traded exchanges, was established in 1792 when “24 brokers and merchants signed the Buttonwood Agreement, under which they agreed to trade securities on a commission basis.” (Anecdotally, at one point the New York Stock Exchange and the Amsterdam Stock Exchange where owned by the same entity, after the NYSE Group / Euronext N.V. Merger in 2007.) Meanwhile, CME, the oldest of the U.S. futures exchanges, traces its roots back to 1848, when the Chicago Board of Trade was founded.
In the early days, trading in both equities and futures typically occurred on a trading floor, or pit, where brokers met face to face to exchange shares or futures contracts. However, in 1971, Nasdaq was founded as the world's first electronic stock market. In the subsequent years the exchange landscape gradually shifted towards electronic-based trading systems (with much of this shift picking up steam in the late 80s and 90s) and by the mid-2000s there remained very few active open-outcry trading floors. As of today, nearly all trading in U.S. equities, U.S. options and exchange traded futures is done electronically.
Initially, the exchanges were non-profit mutual organizations, owned by the exchange members, however in the early 2000s most of the exchanges demutualized and became for-profit, publicly traded companies. After the mass demutualization, a wave of consolidation occurred in the exchange space. As such, the four publicly traded exchanges as we know them today in the U.S. are the result of this M&A wave and the companies today have very diverse product sets and key lines of business.
High Level Company Specifics
In subsequent posts I plan to dive deeper into the specifics of each exchange model and provide my thoughts on how I would position myself within the exchange space. However, below is a brief synopsis of each exchange company and some of the key events / products that shaped the company into what it is today.
Cboe Global Markets, Inc. (Cboe: CBOE 0.00%↑)
CBOE is the home of volatility and S&P 500 index options. CBOE was founded in 1973 as the first options marketplace and over the years eventually created options on the S&P 500 and developed the VIX Index (a measure of U.S. stock market volatility). Following the development of the VIX Index methodology, CBOE eventually created futures and options contracts linked to the value of the VIX, which serve as a core tenant of its transaction business. In 2017, CBOE diversified away from its derivatives focus via its acquisition of Bats Global Markets, which gave CBOE an entry into U.S. and European equities trading and FX trading. Over the past few years, CBOE has completed a number of smaller acquisitions which have further diversified its revenue lines and geographic reach and has also pushed hard into developing and selling proprietary data sets to its customer base. Recently, CBOE has begun a strategic review to bring focus back to its core business lines, which should help bolster its margin profile in years to come.
CME Group Inc. (Nasdaq: CME 0.00%↑)
CME offers multi-asset class futures products, allowing investors and traders to manage risk across a wide array of interest rates, equities, fixed income, energy, commodities and metals. CME was founded in 1898 as one of the first futures exchanges in the country. In 2007, CME acquired CBOT Holdings (founded in 1848), which expanded CME’s asset class reach. This was further bolstered by the subsequent acquisitions of NYMEX Holdings in 2008 and the Kansas City Board of Trade in 2012. In 2018, CME expanded into cash and OTC products (rates and FX) through its acquisition of NEX Group plc. While CME has breadth across asset classes, it has become known as the exchange on which to manage short-term interest rate risk (via its 3M SOFR futures and options contracts) as well as equity market risk (via its S&P 500 cash-settled futures contracts).
Intercontinental Exchange, Inc. (NYSE: ICE 0.00%↑)
ICE has become known as the exchange that has helped shift asset classes from analog to digital, spanning futures, equities, fixed income and mortgages. Intercontinental Exchange was founded in 2000 as a platform to develop a more transparent market for OTC energy contracts. ICE has pursued an aggressive M&A strategy through the years, acquiring energy futures exchanges, adding clearing technology, acquiring the New York Stock Exchange, etc. all with an eye towards digitizing marketplaces. In 2015, ICE expanded into fixed income markets via its acquisition of IDC, a fixed income pricing and reference data provider. In the subsequent years it continued to build its fixed income offerings out through several smaller acquisitions of fixed income trading platforms. In 2018 ICE expanded into mortgage services through its full acquisition of MERSCorp (it had previously owned a stake in MERS). Then in 2020 and 2023 ICE further built out its mortgage technology platform through the acquisitions of Ellie Mae and Black Knight, again, all while keeping with the theme of digitizing marketplaces.
Nasdaq, Inc. (Nasdaq: NDAQ 0.00%↑)
NDAQ is viewed more as a technology company built upon the backbone of the exchange business. Nasdaq was founded in 1971 as a fully electronic alternative to the New York Stock Exchange. NDAQ eventually expanded into U.S. equity options and expanded its stock and options exchange breadth through the acquisitions of the Boston Stock Exchange and the Philadelphia Stock Exchange. In 2008 NDAQ merged with OMX Group, diversifying NDAQ’s geographic reach into the European Nordic markets. In 2017 NDAQ embarked on its strategic pivot which transformed the company into a financial technology powerhouse via a number of acquisitions completed in the subsequent years.
Key Business Lines
Transaction Fees – The Core Trading Businesses
At the heart of the exchange companies is the trading marketplace(s) which serves as the backbone, underpinning any ancillary services the exchange may provide. The marketplace businesses offer trading services where traders and investors come together to buy or sell securities, whether those securities be equities, options, futures contracts or fixed income. At the most basic level, exchanges make money by charging market participants a fee to access the liquidity available on the exchange. Fee structures can vary depending on the asset class and specific exchange, but generally speaking, equities and options exchanges operate maker-taker (or taker-maker) fee models where participants that remove liquidity from an exchange are charged a fee and participants that provide liquidity (by placing resting buy or sell orders on the exchange) receive rebates and the exchange’s revenue is the difference between the two. Meanwhile, on futures exchanges, typically all participants (whether providing liquidity or removing liquidity) pay fees to the exchange for order execution and in many cases these fees include both the customer’s transaction costs as well as clearing related fees. Additionally, as can be expected, exchanges often offer volume-related discounts to clients, so while revenue typically increases in periods of higher transaction activity (usually associated with spikes in volatility), it often does not scale 1:1 as average fee per transaction declines.
Listings
Listing fees generally only apply to equities listings on equities exchanges but also include ETF listings for ETF issuers. Fees are charged to corporates for listing shares on a specific exchange for capital raising purposes. While listing fees make up a fairly small piece of the revenue mix relative to transaction fees they are generally a more stable source of revenue given that after the initial listing fee corporates are charged annual fees to maintain their listing on the exchange and annual listing fees typically scale with number of shares outstanding (as a company grows, share count can grow, increasing the annual listing fee charged). Additionally, being the exchange operator where a given corporation lists its shares can bring trading related benefits to the exchange as the listing venue is responsible for opening and closing trading in those shares each day and the opening and closing cross typically sees higher volumes than can be seen during the intra-day trading session. Competition amongst venues for listings is extremely fierce with the main two U.S. exchanges that offer corporate listings touting various perks for listing at one exchange over the other.
Access & Connectivity
Exchanges also charge clients for access to the exchange. Typically, these fees are charged for quoting, order entry, reporting and for access to certain data feeds and are priced based on the protocol being used by the exchange client. Most exchanges also offer colocation services where customers can rent cabinet space within the exchanges’ data centers for instantaneous access to the exchanges order book and data. Like listing fees, access and connectivity fees are largely recurring in nature.
Data
Given the massive amount of transaction volumes that flow through the exchanges daily (12B equity shares, 44M equity option contracts and 35M futures contracts traded per day across U.S. exchanges), these companies have access to immense volumes of market data, which can include everything from historical transaction prices to information on depth of the order book. The exchanges offer this data to customers via internal market data platforms as well as through third-party distribution partners and data offerings can often include alternative data as well as analytics tools to assist traders and investors.
Other
As the exchanges have grown and evolved some have added ancillary revenue lines to their offerings – in some cases making up a meaningful piece of the revenue pie. These revenue lines include financial technology, regulatory technology, mortgage technology, amongst others. In many cases these ancillary revenue lines are more recurring in nature, thus providing a level of revenue stability to the exchange operating model.
High Level Financial Overview
Revenue Mix
Revenue composition varies greatly from exchange to exchange. In terms of exposure to transaction related revenue, CME has the largest exposure at 80% of the total net revenue pie. Next is CBOE at 60% of the mix followed by ICE at 40% of total net revenue. NDAQ has the least exposure to transaction fees at only 20% of the total. Adding together market data and access and capacity fees, CBOE has the largest exposure at a little over 30% of the mix, followed by ICE at 30%, NDAQ at a bit under 30% and CME at about 10%. For ICE and NDAQ listings comprise 5% and 10% of total net revenues, respectively. This leaves room for ancillary revenues at CME and CBOE of <10%. However, ancillary revenues at ICE and NDAQ are a much larger piece of the pie at about 20% and 40%, respectively. For ICE, ancillary revenues are related to its mortgage technology business while at NDAQ ancillary revenues include financial technology revenue, index revenue and corporate data and analytics revenue related to investor relations and board management.
Exchange Revenue Mix (2024A)
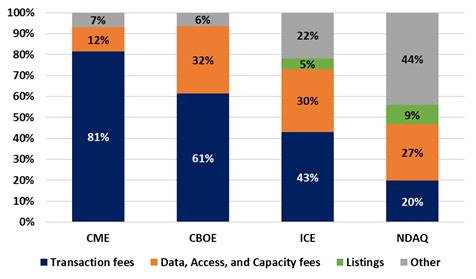
Source: CME, CBOE, ICE and NDAQ 10Ks and my estimates for revenue allocation
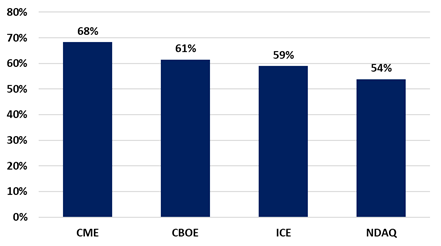
In terms of expense composition, the largest expense line for the exchanges is compensation at 50-60% of total opex. This is followed by technology costs at ~15-20% of the total mix and then a number of other expense lines constitute the remainder of the opex base. In terms of typical expense growth year to year the exchanges typically see expense growth in the mid-single digit range, give or take depending on the company with NDAQ on the higher end, typically targeting 5-8% growth and the other exchanges typically in the 3-5% range. Given the relatively low expense growth and continued solid revenue growth in both transaction and data lines, the exchange models tend to be quite efficient with operating margins and EBITDA margins ranging from about 50% to a bit under 70%.
Exchange Operating Margins
Source: CME, CBOE, ICE, and NDAQ 10Ks
Exchange LTM EBITDA Margins (4Q24)

Source: CME, CBOE, ICE, and NDAQ earnings releases
Due to their strong margin profiles, the exchanges have historically been able to rapidly delever following any acquisition activity requiring debt (as mentioned previously the exchanges have been highly acquisitive in recent years). Additionally, this has allowed the exchanges to return a healthy amount of capital to shareholders over the years.
Volume Overview
As mentioned above, securities trading is the core of the exchange business (though some have de-emphasized this revenue line in recent years). Due to this, volume metrics are tracked extremely closely by analysts that regularly follow the space. The exchanges generally release monthly, as well as daily, volume metrics which can be tracked in the exchanges’ press releases. Below are high level details featuring annual average daily volume across each of the asset classes traded at a specific exchange company. Looking broadly across the exchange landscape, futures and propriety options volumes have generally grown at a mid-single digit plus CAGR since 2016. Meanwhile, cash equities volumes have generally grown in the low-single digit range over the same time frame. Within the U.S., equity options volumes have grown at an elevated CAGR over the same period, which was driven by a huge spike in activity from retail traders during the covid-19 pandemic that has persisted into the post-covid world.
For further detail of volumes by asset class by exchange please see the exchange specific charts below. As a note, I track exchange volumes daily and provide weekly and MTD commentary in my weekly review notes (most recent example here).
CBOE Annual Average Daily Volumes

Source: Company monthly volume releases
CME Annual Average Daily Volumes

Source: Company monthly volume releases
ICE Annual Average Daily Volumes

Source: Company monthly volume releases
NDAQ Annual Average Daily Volumes

Source: Company monthly volume releases
Competition
Competition amongst the exchanges is incredibly fierce and spans both trading assets classes and other business lines. Within the trading businesses, cash equities and equity options trading are highly commoditized as customers can transact the same ticker shares or options across any of the equities and equity options exchanges (of which there are 16 equity exchanges in the U.S. with one more launching in 2025 and 18 equity options exchanges) as well as a litany of off exchange venues including ATS’s and wholesalers. While futures products are proprietary in nature and generally must be traded at the same venue across the life of the contract, competition amongst futures products is intense. For example, within energy futures, ICE is known as the trading hub for Brent crude oil contracts and CME is known as the hub for WTI crude oil contracts, however both also offer products and trading in the other’s core oil product.
In terms of listings, ICE and NDAQ have been fierce competitors for years, though they also compete with international exchanges for both domestic and foreign listings. Amongst the two U.S. exchanges where a company chooses to list its shares depends on a large variety of factors. First, the IPO event is largely seen as a marketing opportunity for the company so corporates going public can choose between the prestige of ringing the New York Stock Exchange opening bell or ringing the opening bell at Nasdaq’s Market Site in Times Square. Next, there are additional services, such as board reporting technology, investor relations resources and shareholder data, that companies can tap into when listing on one versus the other. Additionally, listing on one venue versus the other offers some differences in how a company’s stock is traded as the listing venue is responsible for opening and closing the stock each trading day (Nasdaq’s market is fully electronic where NYSE pairs electronic with a human touch via its designated market makers). Finally, there is a pricing differential between the two, as NYSE initial listing fees and annual listing fees are generally priced at a premium to Nasdaq’s offerings. Historically, NYSE has attracted what I would consider to be more established companies that are seeking the prestige of the NYSE listing, where Nasdaq has had success with more upstart technology companies. With respect to competition for international listings, the biggest draw for the U.S. exchanges is the access to greater liquidity in the U.S. markets, after which the two main U.S. listings venues compete on the same parameters listed above.
On the data side, exchanges’ proprietary data products are constantly being updated and enhanced to suit market participants’ needs. This ever-changing landscape causes competition amongst exchanges to be intense to gain and maintain data customers. Further, competition in the data space does not just stop with other exchanges as these companies are also competing against various third-party vendors that reach well beyond the traditional exchange landscape.
Valuation History
Currently the exchanges all trade in a range of about 23x – 26x NTM EPS. However, over the past 10 years trading ranges have shifted around dramatically as business models have evolved and the macro backdrop has shifted. Looking back 10 years ago, NDAQ traded at the cheapest amongst the exchange group at around 15x NTM EPS while ICE traded at 19x NTM EPS, CME traded at 24x NTM EPS and CBOE traded 26x NTM EPS. Fast forward to today and NDAQ trades at a premium to the other exchanges at just over 25x NTM EPS, followed by ICE at just under 25x, and CBOE and CME both at around 23x NTM EPS. Nasdaq’s multiple expansion has come as the company has shifted its business model away from the more commoditized equity and equity options transaction businesses to more recurring SasS based fintech and capital access businesses. Meanwhile, CME’s multiple has come under pressure of late due to concerns around increased competition with the launch of BGC’s FMX futures platform. Additionally, CBOE’s multiple has come under pressure as its VIX complex volumes have yet to return to the peak levels experienced in 2017 following a massive spike in volatility in early 2018 which negatively impacted several large CBOE clients that created ETF products linked to shorting volatility (via VIX futures contracts).
Exchange Historical NTM EPS Multiples

Source: Tikr.com
Macro Backdrop and Thoughts on What it Could Mean for the Exchanges
In my mind, the current geopolitical backdrop remains quite uncertain. The recent inauguration of President Trump has led many to believe the U.S. should see a continued period of growth, which is likely fair given some of the policies he plans to enact. However, there is also some concern in the market that the tariffs he plans to enact and mass deportations will lead to a resurgence in inflation, which brings into question the pace and extent of further Fed rate cuts. Given the level of uncertainty in the market currently (and the fact that the stock market in general is trading at peak valuations) I believe volatility, both equity market and interest rate volatility, will likely be the norm over the medium term. In this scenario, the trading businesses of the exchanges are likely to continue to perform well. Should equity market volatility persist and interest rates remain higher for longer, this will likely weigh on the listings businesses of the exchanges as companies typically choose to go public when markets are calm and private market valuations are high. Additionally, this type of environment could weigh on rate sensitive businesses (such as ICE’s mortgage technology business), slowing the recovery in this business the market has long been waiting for.