


Weekly Recap for Week Ended March 7, 2025
Weekly Recap of Major Micro / Macro Data Points and Things to Look Forward to in the Week Ahead

Company Specific Updates for Week Ended Mar. 7, 2025
Exchanges
Cboe Global Markets, Inc. (CBOE)
Reports Trading Volumes for February 2025
Volumes across the board increased strongly Y/Y
Seeing 5% upside to 1Q25 EPS from transaction revenues relative to 4Q24 reported transaction revenues
Cboe Canada Completes Technology Migration
Canada exchange platform joins Cboe’s other markets operating on the Cboe Titanium tech platform allowing for more efficient deployment of features and products globally
Announces Promotion of Chief Technology Officer Tim Lipscomb to Executive Vice President
CME Group Inc. (CME)
Use of proceeds to replace 2025 notes outstanding
Reports Record Monthly ADV of 33.1 Million Contracts
Record monthly Interest Rate ADV of 19.2 million contracts
Equity Index ADV of 7.2 million contracts
Energy ADV of 2.8 million contracts
Record February Agricultural ADV of 2.1 million contracts
Foreign Exchange ADV of 1.1 million contracts
Metals ADV of 783,000 contracts
Seeing upside to EPS estimate from strong QTD volumes
Farmer sentiment rises as current conditions improve on U.S. farms
BrokerTec sets new single day volume record
Surpassed $1T in volume on March 3 with record across U.S. Treasuries, U.S. and E.U. Repo and European Government Bond central limit order book, request-for-quote and streaming platforms
Intercontinental Exchange, Inc. (ICE)
Avg. annual property insurance premium rose 14% in 2024
Record 11.4% of borrowers switched carriers in 2024
Homeowners opting for higher deductibles in exchange for premium savings
ADV across futures, equities and options were all up strongly Y/Y in February
RPCs ended the month solid
EPS should increase 9% vs. last quarter due to transaction revenue strength
NYSE awarded Circle of Honor Award from the Medal of Honor Foundation
Nasdaq, Inc. (NDAQ)
Volumes across the board were up double digits Y/Y
Transaction revenue growth should contribute about $0.01 upside to EPS for the quarter relative to 4Q24 reported revenues
Announces working with regulators on 24/5 trading
Follows similar announcements from ICE and CBOE so should come as no surprise
Fixed Income Trading Platforms
MarketAxess Holdings Inc. (MKTX)
Reports February ADV and Market Share Stats
Total ADV increased 27% Y/Y to $43B with rates ADV of $28B (+46% Y/Y) and credit ADV of $15B (+2% Y/Y)
High Grade Credit ADV decreased 8% Y/Y to $7B and market share was down 250bps Y/Y to 17.0%
High Yield Credit ADV was unchanged Y/Y at $1.4B and market share declined 180bps Y/Y to 11.1%
Tradeweb Markets Inc. (TW)
Announces appointment of Rich Repetto (my former boss) to BoD
U.S. government bonds ADV increased 21% Y/Y to $252B
Mortgage ADV increased 21% Y/Y to $228B
Swaps ADV was flat Y/Y at $500B
Fully electronic U.S. credit ADV increased 12% Y/Y to $9B
European Credit ADV was up 25% Y/Y to $3B
Muni Bonds ADV was up 27% Y/Y to $408M
Credit derivatives ADV was up 68% Y/Y to $14B
U.S. ETF ADV decreased 12% Y/Y to $8B
European ETF ADV was up 24% Y/Y to $3.6B
Repo ADV increased 30% Y/Y to $716B
Other money markets ADV increased to $300B
Online Brokers
Interactive Brokers Group, Inc. (IBKR)
Reports Brokerage Metrics and Other Financial Information for February 2025
Client accounts grew 32% Y/Y to 3.54M
Daily Average Revenue Trades (DARTs) grew 48% Y/Y to 3.617M
Client equity grew 31% Y/Y to $589B
Margin loans increased 34% Y/Y to $63B
Client Credit balances increased 20% Y/Y to $124B
The Charles Schwab Corporation (SCHW)
Company Specific Updates Anticipated for the Upcoming Week (Ended Mar. 14, 2025)
Exchanges
None to Note
Fixed Income Trading Platforms
None to Note
Online Brokers
SCHW
February metrics release expected Friday, March 14 (pre-market)
Next Four Weeks Calendar

Source: Company press releases and my estimates around timing
Major Macro Updates for Week Ended Mar. 7, 2025
S&P Final Manufacturing PMI (Feb.) – 52.7 vs. prior 51.6
Construction Spending (Jan.) – (0.2%) vs. consensus 0.1% and prior 0.5%
ISM Manufacturing (Feb.) – 50.3% vs. consensus 50.6% and prior 50.9%
Auto Sales (Feb.) – 16.0 vs. prior 15.5M
ADP Employment (Feb.) – 77k vs. consensus 148k and prior 186k
S&P Final Services PMI (Feb.) – 51% vs. prior 49.7
Factory Orders (Jan.) – 1.7% vs. consensus 1.6% and prior (0.6%)
ISM Services (Feb.) – 53.5% vs. consensus 52.9% and prior 52.8%
Initial jobless claims (week ended Mar. 1) – 221k vs. consensus 235k and prior 242k
U.S. Productivity Final (4Q) – 1.5% vs. consensus 1.2% and prior 1.2%
U.S. Trade Deficit (Jan.) – ($131B) vs. consensus ($129B) and prior ($98B)
Wholesale Inventories (Jan.) – 0.8% vs. consensus 0.5% and prior (0.4%)
U.S. Jobs Report (Feb.) – 151k vs. consensus 170k and prior 125k
U.S. Unemployment Rate (Feb.) – 4.1% vs. consensus 4.0% and prior 4.0%
U.S. Hourly Wages (Feb.) – 0.3% vs. consensus 0.3% and prior 0.5%
Hourly Wages Y/Y (Feb.) – 4.0% vs. consensus 4.2% and prior 4.0%
Consumer Credit (Jan.) – $18.1B vs. consensus $14.5B and prior $40.8B
Major Macro Updates Scheduled for the Upcoming Week (Ended Mar. 14, 2025)
Monday, Mar. 10
None to Note
Tuesday, Mar. 11
NFIB Optimism Index (Feb) – prior 102.8
Job Openings (Jan.) – prior 7.6M
Wednesday, Mar. 12
Consumer Price Index (Feb.) – consensus 0.3% and prior 0.5%
CPI Year over Year (Feb.) – consensus 2.9% and prior 3.0%
Core CPI (Feb.) – consensus 0.3% and prior 0.5%
Core CPI Y/Y (Feb.) – consensus 3.0% and prior 3.0%
Monthly U.S. Federal Budget (Feb.) – consensus ($275B) and prior ($296B)
Thursday, Mar. 13
Initial jobless claims (week ended Mar. 8) – consensus 220k and prior 221k
Producer Price Index (Feb.) – consensus 0.3% and prior 0.4%
PPI Year over Year (Feb.) – prior 3.5%
Core PPI (Feb.) – prior 0.3%
Core PPI Year over Year (Feb.) – prior 3.4%
Friday, Mar. 14
Prelim. Consumer Sentiment (Mar.) – consensus 64.0 and prior 65.7
Exchange Volume Update
Exchange Volumes Over Past Week and W/W Trends
For the week ended March 7, 2025, volumes mainly increased week over week, while volatility metrics increased across the board due to macro concerns.
The average VIX for the week was up 19% from the prior week, average realized volatility was up 32% W/W, average volatility of volatility (as measured by the VVIX) was up 7% W/W and the average MOVE index (U.S. Treasuries volatility) was up 10% W/W.
Futures average daily volumes (ADV) were mixed as CBOE futures volumes were up 25% W/W, CME futures volumes were down 14% W/W, and ICE futures volumes were up 42% W/W.
Total U.S. Equities ADV was up 5% W/W, mainly driven by on-exchange trading as TRF volumes were up 1% W/W. Industry equity options volumes were up 3% W/W while index options volumes increased 15% W/W.
For further detail on weekly volume trends by exchange and by product line please see the charts below.
CME Futures Volumes (M)

Source: Company Daily Volume Releases
ICE Futures (M), U.S. Equities (B) and U.S. Equity Options (M) Volumes
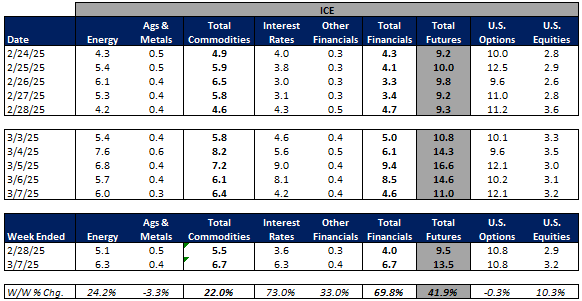
Source: Company Daily Volume Releases, Cboe Global Markets and OCC
CBOE Options (M), Futures (K), U.S. Equity (B), and FX Volumes ($B)

Source: Company Daily Volume Releases and OCC
NDAQ U.S. Equity (B) and Option (M) Volumes

Source: Cboe Global Markets and OCC
U.S. Total Industry Equity Volumes (B)

Source: Cboe Global Markets
U.S. Total Industry Equity Option and Index Option Volumes (M)
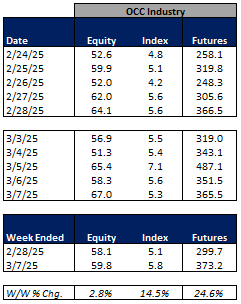
Source: OCC
Volatility Metrics
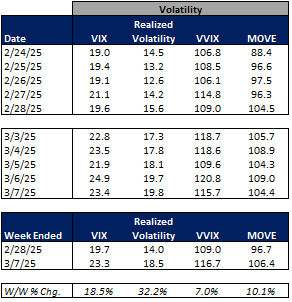
Source: Yahoo Finance
Exchange Volumes MTD / QTD / YTD Trends
Exchange volumes are tracking mainly higher in March-to-date. This comes as volatility is higher MTD on a Y/Y basis.
The average VIX in March-to-date is up 69% Y/Y while realized volatility is up 34% Y/Y and volatility of volatility is up 53% Y/Y. Treasuries volatility is higher as well Y/Y as the average MOVE index in March-to-date is up 8% Y/Y.
Futures volumes are higher Y/Y as ICE futures MTD ADV is up 71% vs. March 2024 ADV. Meanwhile, CME ADV is up 64% Y/Y while CBOE futures ADV is up 72% Y/Y.
In terms of equities and options volumes, total U.S. equities ADV is up 42% MTD while option volumes are up 39% for equity options and up 41% for index options.
For further details on MTD / QTD and YTD ADV please see the charts below.
CME Futures Volumes (M)

Source: Company Daily Volume Releases
ICE Futures (M), U.S. Equities (B) and U.S. Equity Options (M) Volumes
Source: Company Daily Volume Releases, Cboe Global Markets and OCC
CBOE Options (M), Futures (K), U.S. Equity (B), and FX Volumes ($B)

Source: Company Daily Volume Releases and OCC
NDAQ U.S. Equity (B) and Option (M) Volumes
Source: Cboe Global Markets and OCC
U.S. Total Industry Equity Volumes (B)

Source: Cboe Global Markets
U.S. Total Industry Equity Option and Index Option Volumes (M)

Source: OCC
Volatility Metrics
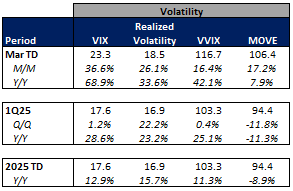
Source: Yahoo Finance
Major Indices, Interest Rates and Company Share Price Trends
Markets ended the week lower with the S&P down 310bps W/W. The week was volatile as concerns over the impact of tariffs on the economic outlook continued to drive sentiment.
In terms of the companies I follow, the online brokers showed the softest performance (-6% to -11%) mainly driven by the macro-outlook. Within the exchanges, CBOE showed the strongest performance, closing out the week up 1%. On the Fixed Income Trading Platform side, MKTX performed well following its February volume release on Thursday which came in largely better than investors had expected despite showing continued market share deterioration Y/Y.

Source: Yahoo Finance, FRED, U.S. Department of the Treasury
Comp Sheet
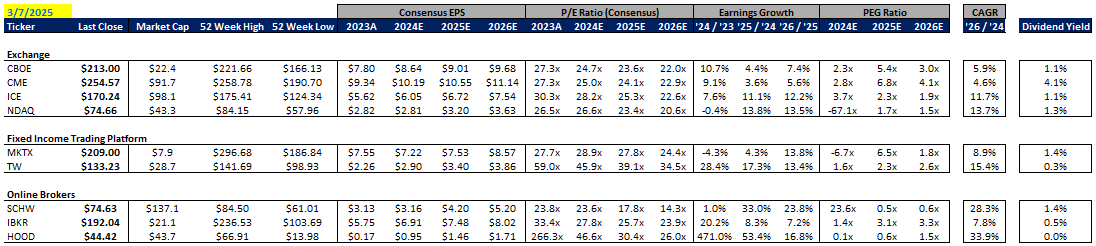
Source: PitchBook
Guidance Tracker
Exchanges
Cboe Global Markets, Inc. (CBOE)

Source: Company documents
Note: CBOE provided additional guidance points / commentary on its 4Q24 earnings call, but key annual highlights are included above for the sake of simplicity
CME Group Inc. (CME)

Source: Company documents
Note: CME provided additional guidance points / commentary on its 4Q24 earnings call, but key annual highlights are included above for the sake of simplicity
Intercontinental Exchange, Inc. (ICE)

Source: Company documents
Note: ICE provided additional guidance points / commentary on its 4Q24 earnings call, but key annual highlights are included above for the sake of simplicity
Nasdaq, Inc. (NDAQ)

Source: Company documents
Note: NDAQ provided additional guidance points / commentary on its 4Q24 earnings call, but key annual highlights are included above for the sake of simplicity
Fixed Income Trading Platforms
MarketAxess Holdings Inc. (MKTX)

Source: Company documents
Note: MKTX provided additional guidance points / commentary on its 4Q24 earnings call, but key annual highlights are included above for the sake of simplicity
Tradeweb Markets Inc. (TW)

Source: Company documents
Note: TW provided additional guidance points / commentary on its 4Q24 earnings call, but key annual highlights are included above for the sake of simplicity
Online Brokers
The Charles Schwab Corporation (SCHW)
