


Weekly Recap for Week Ended March 14, 2025
Weekly Recap of Major Micro / Macro Data Points and Things to Look Forward to in the Week Ahead

Company Specific Updates for Week Ended Mar. 14, 2025
Exchanges
Cboe Global Markets, Inc. (CBOE)
Plans to Launch S&P 500® Equal Weight Index Options on April 14, 2025
Options will be cash-settled and based on 1/10th the value of the S&P 500 EWI
Offers clients different exposure to the same constituents of the S&P 500
CME Group Inc. (CME)
Completed public offering of $750M senior notes
As previously announced offering replaces $750M in senior notes due in 2025
Bearing interest rate of 4.400%
To Launch Bloomberg Commodity (BCOM) Subindex Futures on March 31
Announced first quarter earnings release date of April 23, pre-market
Fixed Income Trading Platforms
None to Note
Online Brokers
The Charles Schwab Corporation (SCHW)
Trading activity index moves higher amid higher volatility
Index increased to 51.94 from 49.45 in January
Reports monthly metrics for February
Net new assets came in at $48B (5.6% annualized growth rate)
Average interest earning assets decreased 2% M/M to $425B
Transactional sweep cash increased $4.7B to $321B
Robinhood Markets, Inc. (HOOD)
Reports February operating data
Funded customers increased 8% Y/Y to 25.6M
Assets Under Custody increased 58% Y/Y (down 8% M/M) to $187B
Net Deposits were $4.8B, an annualized growth rate of 28% vs. January AUC
Margin balances increased 129% Y/Y to $8.7B
Cash Sweep Balances increased 45% Y/Y to $26.2B
Sec lending revenue was $22M (+69% Y/Y, -12% M/M
Company Specific Updates Anticipated for the Upcoming Week (Ended Mar. 21, 2025)
Exchanges
None to Note
Fixed Income Trading Platforms
None to Note
Online Brokers
None to Note
Next Four Weeks Calendar

Source: Company press releases and my estimates around timing
Major Macro Updates for Week Ended Mar. 14, 2025
NFIB Optimism Index (Feb) –100.7 vs. consensus 101.0 and prior 102.8
Job Openings (Jan.) – 7.7M vs. consensus 7.6M and prior 7.6M
Consumer Price Index (Feb.) – 0.2% vs. consensus 0.3% and prior 0.5%
CPI Year over Year (Feb.) – 2.8% vs. consensus 2.9% and prior 3.0%
Core CPI (Feb.) – 0.2% vs. consensus 0.3% and prior 0.5%
Core CPI Y/Y (Feb.) – 3.1% vs. consensus 3.0% and prior 3.0%
Monthly U.S. Federal Budget (Feb.) – ($307B) vs. consensus ($296B) and prior ($296B)
Initial jobless claims (week ended Mar. 8) – 220k vs. consensus 225k and prior 221k
Producer Price Index (Feb.) – 0.0% vs. consensus 0.3% and prior 0.4%
PPI Year over Year (Feb.) – 3.2% vs. prior 3.7%
Core PPI (Feb.) – 0.2% vs. consensus 0.3% and prior 0.3%
Core PPI Year over Year (Feb.) – 3.3% vs. prior 3.4%
Prelim. Consumer Sentiment (Mar.) – 57.9 vs. consensus 63.2 and prior 65.7
Major Macro Updates Scheduled for the Upcoming Week (Ended Mar. 21, 2025)
Monday, Mar. 17
U.S. Retail Sales (Feb.) – consensus 0.6% and prior (0.9%)
Retail Sales Minus Autos (Feb.) – consensus 0.3% and prior (0.4%)
Empire State Manufacturing Survey (Mar.) – consensus (1.8) and prior 5.7
Business Inventories (Jan.) – consensus 0.3% and prior (0.2%)
Homebuilder Confidence Index (Mar.) – consensus 42 and prior 42
Tuesday, Mar. 18
Housing Starts (Feb.) – consensus 1.38M and prior 1.37M
Building Permits (Feb.) – consensus 1.45M and prior 1.48M
Import Price Index (Feb.) – consensus (0.2%) and prior 0.3%
Import Price Index Minus Fuel (Feb.) – prior 0.1%
Industrial Production (Feb.) – consensus 0.3% and prior 0.5%
Capacity Utilization (Feb.) – consensus 77.9% and prior 77.8%
Wednesday, Mar. 19
FOMC Rate Decision and Chair Press Conference
Thursday, Mar. 20
Initial jobless claims (week ended Mar. 15) – consensus 222k and prior 220k
Philadelphia Fed Manufacturing Survey (Mar.) – consensus 12.0 and prior 18.1
Existing Home Sales (Feb.) – consensus 3.97M and prior 4.08M
U.S. Leading Economic Indicators (Feb.) – consensus (0.2%) and prior 0.3%
Friday, Mar. 21
None to Note
Exchange Volume Update
Exchange Volumes Over Past Week and W/W Trends
For the week ended March 14, 2025, volumes mainly declined week over week, while volatility metrics generally increased due to macro concerns.
The average VIX for the week was up 8% from the prior week, average realized volatility was up 26% W/W, average volatility of volatility (as measured by the VVIX) was essentially flat W/W and the average MOVE index (U.S. Treasuries volatility) was up 1% W/W.
Futures average daily volumes (ADV) declined as CBOE futures volumes were down 4% W/W, CME futures volumes were down 17% W/W, and ICE futures volumes were down 27% W/W.
Total U.S. Equities ADV was essentially flatW/W, mainly driven by off-exchange trading as TRF volumes were up 2% W/W. Industry equity options volumes were down 4% W/W while index options volumes increased 3% W/W.
For further detail on weekly volume trends by exchange and by product line please see the charts below.
CME Futures Volumes (M)

Source: Company Daily Volume Releases
ICE Futures (M), U.S. Equities (B) and U.S. Equity Options (M) Volumes

Source: Company Daily Volume Releases, Cboe Global Markets and OCC
CBOE Options (M), Futures (K), U.S. Equity (B), and FX Volumes ($B)

Source: Company Daily Volume Releases and OCC
NDAQ U.S. Equity (B) and Option (M) Volumes

Source: Cboe Global Markets and OCC
U.S. Total Industry Equity Volumes (B)
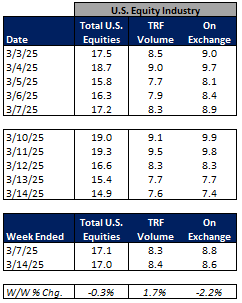
Source: Cboe Global Markets
U.S. Total Industry Equity Option and Index Option Volumes (M)
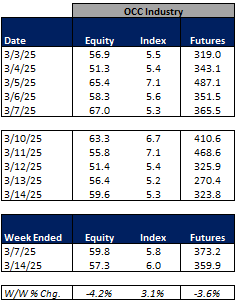
Source: OCC
Volatility Metrics

Source: Yahoo Finance
Exchange Volumes MTD / QTD / YTD Trends
Exchange volumes are tracking mainly higher in March-to-date. This comes as volatility is higher MTD on a Y/Y basis.
The average VIX in March-to-date is up 73% Y/Y while realized volatility is up 54% Y/Y and volatility of volatility is up 40% Y/Y. Treasuries volatility is higher as well Y/Y as the average MOVE index in March-to-date is up 8% Y/Y.
Futures volumes are higher Y/Y as ICE futures MTD ADV is up 46% vs. March 2024 ADV. Meanwhile, CME ADV is up 48% Y/Y while CBOE futures ADV is up 68% Y/Y.
In terms of equities and options volumes, total U.S. equities ADV is up 40% MTD while option volumes are up 34% for equity options and up 41% for index options.
For further details on MTD / QTD and YTD ADV please see the charts below.
CME Futures Volumes (M)

Source: Company Daily Volume Releases
ICE Futures (M), U.S. Equities (B) and U.S. Equity Options (M) Volumes
Source: Company Daily Volume Releases, Cboe Global Markets and OCC
CBOE Options (M), Futures (K), U.S. Equity (B), and FX Volumes ($B)

Source: Company Daily Volume Releases and OCC
NDAQ U.S. Equity (B) and Option (M) Volumes

Source: Cboe Global Markets and OCC
U.S. Total Industry Equity Volumes (B)
Source: Cboe Global Markets
U.S. Total Industry Equity Option and Index Option Volumes (M)
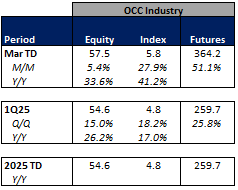
Source: OCC
Volatility Metrics
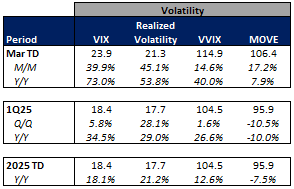
Source: Yahoo Finance
Major Indices, Interest Rates and Company Share Price Trends
Markets ended the week lower with the S&P down 230bps W/W. The week was volatile as concerns over the impact of tariffs on the economic outlook continued to drive sentiment.
In terms of the companies I follow, the online brokers showed the softest performance (+3% to -13%) mainly driven by the macro-outlook. Within the exchanges, CME showed the strongest performance, closing out the week up 2%. On the Fixed Income Trading Platform side, TW performed the best, increasing 2% on limited news.
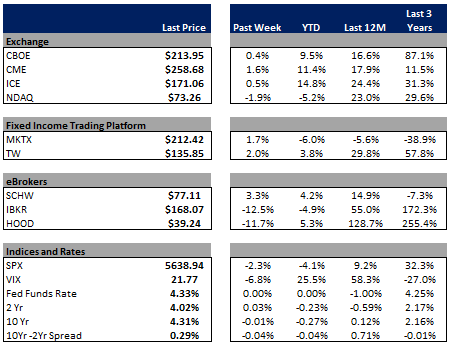
Source: Yahoo Finance, FRED, U.S. Department of the Treasury
Comp Sheet

Source: PitchBook
Guidance Tracker
Exchanges
Cboe Global Markets, Inc. (CBOE)

Source: Company documents
Note: CBOE provided additional guidance points / commentary on its 4Q24 earnings call, but key annual highlights are included above for the sake of simplicity
CME Group Inc. (CME)

Source: Company documents
Note: CME provided additional guidance points / commentary on its 4Q24 earnings call, but key annual highlights are included above for the sake of simplicity
Intercontinental Exchange, Inc. (ICE)

Source: Company documents
Note: ICE provided additional guidance points / commentary on its 4Q24 earnings call, but key annual highlights are included above for the sake of simplicity
Nasdaq, Inc. (NDAQ)

Source: Company documents
Note: NDAQ provided additional guidance points / commentary on its 4Q24 earnings call, but key annual highlights are included above for the sake of simplicity
Fixed Income Trading Platforms
MarketAxess Holdings Inc. (MKTX)

Source: Company documents
Note: MKTX provided additional guidance points / commentary on its 4Q24 earnings call, but key annual highlights are included above for the sake of simplicity
Tradeweb Markets Inc. (TW)

Source: Company documents
Note: TW provided additional guidance points / commentary on its 4Q24 earnings call, but key annual highlights are included above for the sake of simplicity
Online Brokers
The Charles Schwab Corporation (SCHW)
