
Weekly Recap for Week Ended July 11, 2025
Weekly Recap of Major Micro / Macro Data Points and Things to Look Forward to in the Week Ahead

Significant News / Developments from Week Ended Jul. 11, 2025
Crypto Off-Exchange Settlement Company Announces Funding Round
On Monday, BridgePort, an institutional middleware provider for off-exchange settlement announced a $3.2M seed round to accelerate its platform development and build out its team. The round was led by Further Ventures with additional backing from VIRT 0.00%↑, XBTO, Blockchain Founders Fund, Fun Fair Ventures and Humla Ventures. BridgePort helps eliminate the need for prefunding and addresses credit and settlement risk in institutional crypto markets, enhancing capital efficiency for trading firms. BridgePort also announced that its platform is live in production and that it is actively onboarding exchanges and custodians. All three of BridgePort’s founders worked together at CME 0.00%↑’s EBS and BrokerTec.
What Am I Reading?!?!
So, a medical device technology company (Biosig Technologies) focused on ablation treatments of cardiovascular arrhythmias was generating $40K a year in revenue and losing $13M a year in operating profits. In May, said biotech company merges with Streamex Exchange Corporation, a company focused on real-world asset tokenization of commodities, specifically gold. Now the two combined companies have announced a $1.1B capital raise ($1M in convertible debt and $1B equity line of credit) from “a leading institutional investor” in order to “secure their position as a gold treasury company, continue investment in RWA blockchain technology, and seize opportunities within their core markets.” I’ve said this before, but truly, what a time to be alive. Naturally, the market loved the initial combination of the two businesses, with the stock ($BSGM for those curious) rising from $1.37 prior to the merger announcement to $11.55 on July 7. However, since the announcement of this capital raise, the stock is now trading at $6.30. I’ll say it again, what a time to be alive. This crypto/blockchain/tokenization bubble will pop eventually and the aftermath of that is likely to be spectacular.
Programming Note
As an FYI (not that I have a ton of followers, but still want those of you who do follow to be informed) - I will be OOO from the evening of 7/17 through 7/27. As such, there will likely be no weekly update for the week ended 7/18 and the week ended 7/25. Additionally, this means I will be delayed in getting earnings recaps out for IBKR, SCHW, CME & NDAQ. I fully anticipate having full earnings reviews out for all four during the week ended 8/1.
Company Specific Updates for Week Ended Jul. 11, 2025
Exchanges
Cboe Global Markets, Inc. (CBOE)
Launch Pan-European EBBO Trading Solution for Retail Investors
New service offers free execution of retail orders at or better than the European Best Bid and Offer (EBBO) across 18 markets
CBOE also introducing a dedicated Retail Liquidity Provider Programme (RLP) which incentivizes market makers to post orders at the EBBO that are exclusively for interaction with retail order flow
Retail orders will also be eligible to benefit from free execution on other Cboe Europe trading mechanisms including Dark and Periodic Auctions order books, which could potentially offer price improvements
Retail orders will be able to interact with both RLP and non-RLP participants, executing orders at the best available price
Service set to go live on September 8, pending regulatory approval
CME Group Inc. (CME)
Intercontinental Exchange, Inc. (ICE)
Amid a Cooling Housing Market, Early Signs of Homeowner Risk Emerge
Softening home prices expand from Sunbelt to Western states, driving negative equity
ARM and temporary buydown usage reflect affordability pressure
Student loan delinquency greatly increases mortgage delinquency risk
Sets New H1 Record With 1.2 Billion Contracts Traded
Record 1Haverage daily volume of 10 million contracts, of which approximately 6 million were commodity contracts
Launching next gen U.S. Technology Index as well as a number of other indices
Nasdaq, Inc. (NDAQ)
Reports June and 2Q Operating Statistics
I previewed much of this in my exchange volume note on July 1 but ADV was up double digits Y/Y, though were mixed M/M as volatility subsided
NDAQ also released quarterly RPC detail for 2Q, showing RPCs largely flat Q/Q
My EPS estimate came up a bit for the quarter on continued strong Y/Y volumes (had assumed more modest Y/Y growth in June)

Source: company documents
Fixed Income Trading Platforms
MarketAxess Holdings Inc. (MKTX)
Reports June Volumes and Fee Per Million
Total credit ADV for June was $15.7B, which was down 4% M/M but up 12% Y/Y
Total rates ADV for the month came in at $27.4B (-8% M/M, +22% Y/Y)
For the full quarter, credit FPM came in at $138 (-1% Q/Q, -7% Y/Y) while rates FPM came in at $3.90 (-7% Q/Q, -12% Y/Y)
Based on these results, I did raise my EPS estimate for the quarter a bit to reflect the continuation of strong volumes through quarter end

Source: company documents
Tradeweb Markets Inc. (TW)
Reports June Volumes and 2Q FPM
Total rates ADV for June was $1.3T (-5% M/M, +7% Y/Y)
Total credit ADV for the month was $29B (-16% M/M, -6% Y/Y)
Equities ADV ended the month at $24B (+3% M/M, +6% Y/Y)
Money markets ADV finished June at $1.0T (-1% M/M, +68% Y/Y)
Blended FPM across all asset classes was $2.30, unchanged Q/Q (-6% Y/Y). Meanwhile, preliminary fixed fees for rates, credit, equities and money markets came in at $93.8M (+10% Q/Q, +25% Y/Y)
Based on these results, I raised my EPS estimate for 2Q25 to account for the continued strong volume environment as well as solid FPM and fixed fee commentary

Source: company documents
Online Brokers
eToro Group Ltd. (ETOR)
Announces 2Q25 Earnings Release Date
Tuesday, August 12 pre-market
Conference call to be held at 8:30am ET
Interactive Brokers Group, Inc. (IBKR)
Debuts New App to Educate Next Generation of Investors
IBKR InvestMentor is a new mobile microlearning app
Offers free, accessible educational content to beginner and aspiring investors through short, interactive lessons that build foundational knowledge in economics and investing
Covers stocks, bonds, futures, options and investment strategies
The Charles Schwab Corporation (SCHW)
STAX Score Climbs Slightly After Three Months of Decline
increased slightly to 40.66 in June, up from its score of 39.68 in May
Schwab clients gingerly dipped their toes in the water but stayed cautious
Grows Institutional No Transaction Fee Fund Offering for Independent Advisors
the expanded line-up will nearly double its size to approximately 2,000 funds across 58 asset managers
Americans Say It Takes More Money to Be Financially Comfortable Now Than It Did a Year Ago
Americans believe it takes $839,000 to be “financially comfortable,” according to Charles Schwab’s 2025 Modern Wealth Survey
This is up from $778,000 reported last year, but down from the $1 million Americans cited in 2023
Company Specific Updates Anticipated for the Upcoming Week (Ended Jul. 18, 2025)
Exchanges
None to Note
Fixed Income Trading Platforms
None to Note
Online Brokers
Interactive Brokers Group, Inc. (IBKR)
2Q25 Earnings Release
Thursday, July 17
Post-close
The Charles Schwab Corporation (SCHW)
2Q25 Earnings Release
Friday, July 18
Pre-market
Next Four Weeks Calendar

Source: Company press releases and my estimates around timing
Major Macro Updates for Week Ended Jul. 11, 2025
NFIB Optimism Index (Jun.) – 98.6 vs. consensus 98.8 and prior 98.8
Consumer Credit (May) – $5.1B vs. consensus $10.0B and prior $17.9B
Wholesale Inventories – (0.3%) vs. consensus (0.3%) and prior 0.1%
Initial Jobless Claims (week ended Jul. 5) – 227k vs. consensus 235k and prior 232k
Monthly U.S. Federal Budget – $27B vs. consensus ($20.5B) and prior ($71.0B)
Major Macro Updates Scheduled for the Upcoming Week (Ended Jul. 18, 2025)
Monday, Jul. 14
None to Note
Tuesday, Jul. 15
Consumer Price Index (Jun.) – consensus 0.3% and prior 0.1%
CPI Y/Y (Jun.) – consensus 2.7% and prior 2.4%
Core CPI (Jun.) – consensus 0.3% and prior 0.1%
Core CPI Y/Y (Jun.) – consensus 3.0% and prior 2.8%
Empire State Manufacturing Survey (Jul.) – consensus (9.0) and prior (16.0)
Wednesday, Jul. 16
Producer Price Index (Jun.) – consensus 0.2% and prior 0.1%
Core PPI (Jun.) – prior 0.1%
PPI Y/Y (Jun.) – prior 2.6%
Core PPI Y/Y (Jun.) – prior 2.7%
Industrial Production (Jun.) – consensus 0.1% and prior 0.2%
Capacity Utilization (Jun.) – consensus 77.4% and prior 77.4%
Fed Beige Book Released
Thursday, Jul. 17
Initial Jobless Claims (week ended Jul. 12) – consensus 233k and prior 227k
U.S. Retail Sales (Jun.) – consensus 0.2% and prior (0.9%)
Retail Sales Minus Autos (Jun.) – consensus 0.3% and prior (0.3%)
Import Price Index (Jun.) – consensus 0.3% and prior 0.0%
Import Price Index Minus Fuel (Jun.) – prior 0.3%
Philadelphia Fed Manufacturing Survey (Jul.) – consensus (0.3%) and prior (4.0%)
Business Inventories (May) – consensus 0.0% and prior 0.0%
Homebuilder Confidence Index (Jul.) – consensus 33 and prior 32
Friday, Jul. 18
Housing Starts (Jun.) – consensus 1.30M and prior 1.26M
Building Permits (Jun.) – consensus 1.39M and prior 1.39M
Preliminary Consumer Sentiment (Jul.) – consensus 62.0 and prior 60.7
Exchange Volume Update
Exchange Volumes Over Past Week and W/W Trends
For the week ended July 11, 2025, volumes and volatility were mixed W/W.
The average VIX for the week was down 1% from the prior week, average realized volatility was unchanged W/W, average volatility of volatility (as measured by the VVIX) was up 3% W/W and the average MOVE index (U.S. Treasuries volatility) was down 5% W/W.
Futures average daily volumes (ADV) were mixed as CBOE futures volumes were up 33% W/W, CME futures volumes were down 15% W/W, and ICE futures volumes were down 2% W/W.
Total U.S. Equities ADV was up 7%W/W, as TRF volumes rose 8% W/W while on-exchange volume were up 7% W/W. Industry equity options volumes were up 1% W/W while index options volumes rose 2% W/W.
For further detail on weekly volume trends by exchange and by product line please see the charts below.
CME Futures Volumes (M)

Source: Company Daily Volume Releases
ICE Futures (M), U.S. Equities (B) and U.S. Equity Options (M) Volumes

Source: Company Daily Volume Releases, Cboe Global Markets and OCC
CBOE Options (M), Futures (K), U.S. Equity (B), and FX Volumes ($B)

Source: Company Daily Volume Releases and OCC
NDAQ U.S. Equity (B) and Option (M) Volumes

Source: Cboe Global Markets and OCC
U.S. Total Industry Equity Volumes (B)

Source: Cboe Global Markets
U.S. Total Industry Equity Option and Index Option Volumes (M)

Source: OCC
Volatility Metrics

Source: Yahoo Finance
Exchange Volumes MTD / QTD / YTD Trends
Exchange volumes are tracking mixed in July-to-date relative to June and Y/Y. This comes as volatility is mainly higher MTD on a Y/Y basis.
The average VIX in July-to-date is up 15% Y/Y while realized volatility is up 11% Y/Y and volatility of volatility is up 4% Y/Y. Treasuries volatility is lower Y/Y as the average MOVE index in July-to-date is down 10% Y/Y.
Futures volumes are mixed Y/Y as ICE futures MTD ADV is up 10% vs. July 2024 ADV. Meanwhile, CME ADV is down 13% Y/Y while CBOE futures ADV is down 29% Y/Y.
In terms of equities and options volumes, total U.S. equities ADV is up 50% MTD while option volumes are up 6% for equity options and up 3% for index options.
For further details on MTD / QTD and YTD ADV please see the charts below.
CME Futures Volumes (M)

Source: Company Daily Volume Releases
ICE Futures (M), U.S. Equities (B) and U.S. Equity Options (M) Volumes

Source: Company Daily Volume Releases, Cboe Global Markets and OCC
CBOE Options (M), Futures (K), U.S. Equity (B), and FX Volumes ($B)

Source: Company Daily Volume Releases and OCC
NDAQ U.S. Equity (B) and Option (M) Volumes

Source: Cboe Global Markets and OCC
U.S. Total Industry Equity Volumes (B)

Source: Cboe Global Markets
U.S. Total Industry Equity Option and Index Option Volumes (M)

Source: OCC
Volatility Metrics

Source: Yahoo Finance
Major Indices, Interest Rates and Company Share Price Trends
The market closed out the week lower, falling 30bps W/W. Yields were higher and the curve steepened a bit and the VIX was unchanged on the week.
In terms of the companies I follow, BULL and ETOR showed the weakest performance, falling 13% and 8%, respectively, W/W. Rounding out eBroker land, HOOD was up 4% on the week, IBKR rose 1% and SCHW was up less than 1%. Within fixed income trading land, TW fell 2% while MKTX was flat. Within the exchanges, CBOE rose 2% on the week, CME fell 1%, NDAQ fell 1% and ICE declined 1%.

Source: Yahoo Finance, FRED, U.S. Department of the Treasury
Comp Sheet

Source: Yahoo Finance
Guidance Tracker
Exchanges
Cboe Global Markets, Inc. (CBOE)
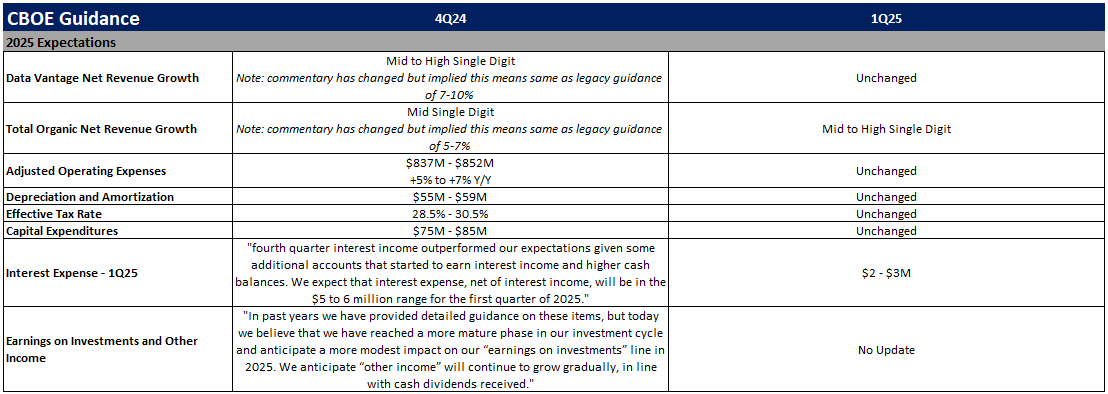
Source: Company documents
Note: CBOE provided additional guidance points / commentary on its 1Q25 earnings call, but key annual highlights are included above for the sake of simplicity
CME Group Inc. (CME)

Source: Company documents
Note: CME provided additional guidance points / commentary on its 1Q25 earnings call, but key annual highlights are included above for the sake of simplicity
Intercontinental Exchange, Inc. (ICE)

Source: Company documents
Note: ICE provided additional guidance points / commentary on its 1Q25 earnings call, but key annual highlights are included above for the sake of simplicity
Nasdaq, Inc. (NDAQ)

Source: Company documents
Note: NDAQ provided additional guidance points / commentary on its 1Q25 earnings call, but key annual highlights are included above for the sake of simplicity
Fixed Income Trading Platforms
MarketAxess Holdings Inc. (MKTX)

Source: Company documents
Note: MKTX provided additional guidance points / commentary on its 1Q25 earnings call, but key annual highlights are included above for the sake of simplicity
Tradeweb Markets Inc. (TW)

Source: Company documents
Note: TW provided additional guidance points / commentary on its 1Q25 earnings call, but key annual highlights are included above for the sake of simplicity
Online Brokers
Robinhood Markets, Inc. (HOOD)

Source: Company documents
Note: HOOD provided additional guidance points / commentary on its 1Q25 earnings call, but key annual highlights are included above for the sake of simplicity
Interactive Brokers Group, Inc. (IBKR)
Source: Company documents
Note: IBKR provided additional guidance points / commentary on its 1Q25 earnings call, but key annual highlights are included above for the sake of simplicity
The Charles Schwab Corporation (SCHW)
