


Weekly Recap for Week Ended January 24, 2025
Weekly Recap of Major Micro / Macro Data Points and Things to Look Forward to in the Week Ahead

Company Specific Updates for Week Ended Jan. 24, 2025
SCHW
Reported strong EPS Beat, posting 4Q24 EPS of $1.01 vs. consensus $0.91
Beat driven by topline with revenue $130M above consensus
NIM expanded significantly (+25bps Q/Q to 2.33%) driven by supplemental funding pay down
Achieved capital ratio targets, setting up potential capital return in 2025
Guidance for 2025 is strong, implying EPS of $4.10 - $4.20 for the year
IBKR
Beat driven by topline with revenue $20M above consensus
Company Specific Updates Anticipated for the Upcoming Week (Ended Jan. 31, 2025)
NDAQ – 4Q24 EPS Expected Wednesday, Jan. 29 - Consensus expects EPS $0.75 on Revenue of $1.23B
Major Macro Updates for Week Ended Jan. 24, 2025
Initial Jobless Claims for Week Ended 1/18/25 – 223k vs. consensus 221k & prior week 217k
U.S. Services PMI for January – 52.8 vs. forecast 56.5 and prior month 56.8
U.S. Manufacturing PMI for January – 50.1 vs. forecast 49.7 and prior month 49.4
Existing Home Sales for December – 4.24M vs. forecast 4.2M and prior month 4.15M
Consumer Sentiment – 71.1 vs. forecast 73.2 and prior month 74.0
Major Macro Updates Scheduled for the Upcoming Week (Ended Jan. 31, 2025)
Monday, Jan. 27
New Home Sales (Dec.) – forecast 671k, prior month 664k
Tuesday, Jan. 28
Case-Shiller Home Price Index (Nov.) – prior month 4.2%
Consumer confidence (Jan.) – forecast 106.3, prior month 104.7
Wednesday, Jan. 29
FOMC Rate Decision (2:00pm ET) & Press Conference (Fed widely expected to keep rates on hold)
Thursday, Jan. 30
Initial jobless claims (week ended Jan. 25) – forecast 225k, prior 223k
Pending home sales (Dec.) – forecast 1.0%, prior month 2.2%
Friday, Jan. 31
PCE (Dec.) – forecast 2.6%, prior month 2.4%
Core PCE (Dec.) – forecast 2.8%, prior month 2.8%
Exchange Volume Update
Exchange Volumes Over Past Week and W/W Trends
For the week ended January 24, 2025, volumes generally declined week over week as volatility came down across the board. Note that Monday, January 20 was a holiday across most markets / asset classes so weekly ADV calcs for the week ended January 24, 2025 are (in most cases) based on a four day week.
The average VIX for the week was down 13% from the prior week, average realized volatility was down 16% W/W, average volatility of volatility (as measured by the VVIX) was down 4% W/W and the average MOVE index (U.S. Treasuries volatility) was down 7% W/W.
Futures average daily volumes (ADV) declined as well (though performance was mixed across exchanges and products) as CBOE futures ADV was down 22% W/W, CME futures ADV was down 12% W/W (driven by a 17% W/W decline in Interest Rate futures) and ICE futures ADV was down 4% W/W.
Total U.S. Equities ADV was down 2% W/W, mainly driven by on-exchange trading as TRF volumes were up 1% W/W. Industry equity and index options ADV also declined, down 8% and 5% W/W, respectively.
For further detail on weekly volume trends by exchange and by product line please see the charts below.
CME Futures Volumes (M)

Source: Company Daily Volume Releases
ICE Futures (M), U.S. Equities (B) and U.S. Equity Options (M) Volumes

Source: Company Daily Volume Releases, Cboe Global Markets and OCC
CBOE Options (M), Futures (K), U.S. Equity (B), and FX Volumes ($B)

Source: Company Daily Volume Releases and OCC
NDAQ U.S. Equity (B) and Option (M) Volumes

Source: Cboe Global Markets and OCC
U.S. Total Industry Equity Volumes (B)

Source: Cboe Global Markets
U.S. Total Industry Equity Option and Index Option Volumes (M)

Source: OCC
Source: OCC
Volatility Metrics

Source: Yahoo Finance
Exchange Volumes MTD / QTD / YTD Trends
Exchange volumes have started the year on a high note with most products showing Y/Y monthly ADV growth in January-to-date. This comes as volatility is generally higher on a Y/Y basis MTD.
The average VIX in January-to-date is up 25% Y/Y while realized volatility is up 54% Y/Y and volatility of volatility is up 23% Y/Y. Treasuries volatility is lower Y/Y as the average MOVE index in January -to-date is down 13% Y/Y.
Futures volumes are somewhat mixed as ICE futures MTD ADV is up 22% vs. January 2024 ADV. Meanwhile, CME ADV is up 1% Y/Y while CBOE futures ADV is down 6% Y/Y.
In terms of equities and options volumes, total U.S. equities ADV is up 35% MTD while option volumes are up 24% for equity options and 11% for index options.
For further detail on MTD / QTD / YTD ADV please see the charts below.
CME Futures Volumes (M)

Source: Company Daily Volume Releases
ICE Futures (M), U.S. Equities (B) and U.S. Equity Options (M) Volumes

Source: Company Daily Volume Releases, Cboe Global Markets and OCC
CBOE Options (M), Futures (K), U.S. Equity (B), and FX Volumes ($B)

Source: Company Daily Volume Releases and OCC
NDAQ U.S. Equity (B) and Option (M) Volumes

Source: Cboe Global Markets and OCC
U.S. Total Industry Equity Volumes (B)
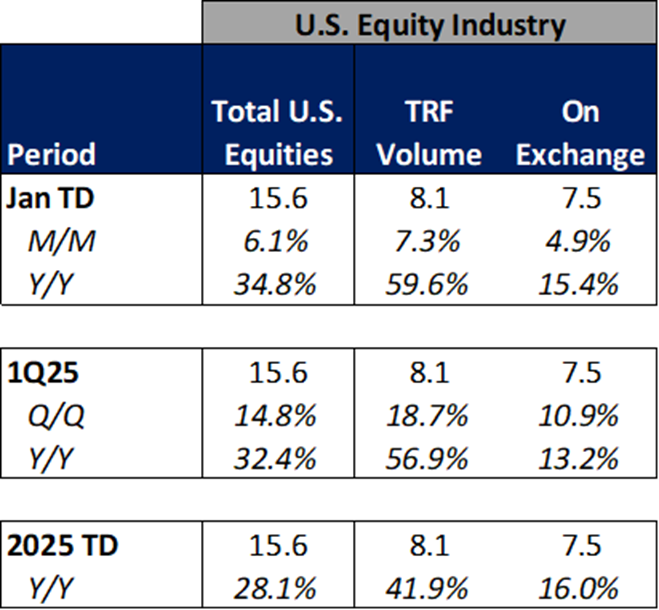
Source: Cboe Global Markets
U.S. Total Industry Equity Option and Index Option Volumes (M)

Source: OCC
Volatility Metrics

Source: Yahoo Finance
Major Indices, Interest Rates and Company Share Price Trends
Over the past week volatility fell and the S&P ended higher following the presidential inauguration and hopes that new policies will be positive for business while tariff talk seems to have softened slightly. In terms of companies I follow, IBKR and SCHW performed strongest over the past week due to strong topline earnings results out of both companies. Within the exchanges, CME and CBOE lagged as volatility and volumes declined from the prior week average.

Source: Yahoo Finance, FRED, U.S. Department of the Treasury
Comp Sheet
