


Weekly Recap for Week Ended February 21, 2025
Weekly Recap of Major Micro / Macro Data Points and Things to Look Forward to in the Week Ahead

Company Specific Updates for Week Ended Feb. 21, 2025
Exchanges
Intercontinental Exchange, Inc. (ICE)
ICE Bonds Reported Record Trading in 2024
Corporate bond notional volume increased 40% Y/Y
Muni notional volume increased 5% Y/Y
Agencies notional volume increased 20% Y/Y
ICE attributed the growth to increased adoption of trading protocols by retail-oriented brokerage firms and institutional investors
Fixed Income Trading Platforms
None to Note
Online Brokers
None to Note
Company Specific Updates Anticipated for the Upcoming Week (Ended Feb. 28, 2025)
Exchanges
None to Note
Fixed Income Trading Platforms
None to Note
Online Brokers
None to Note
Next Four Weeks Calendar

Source: Company press releases and my estimates around timing
Major Macro Updates for Week Ended Feb. 21, 2025
Homebuilder Confidence Index for February – 42 vs. consensus 46 and prior 47
Housing Starts for January –1.37M vs. consensus 1.4M and prior 1.5M
Building Permits for January – 1.48M vs. consensus 1.46M and prior 1.48M
Initial Jobless Claims for week ended Feb. 15 – 219k vs. consensus 215k and prior 213k
Philadelphia Fed Manufacturing Survey for February – 18.1 vs. consensus 13.2 and prior 44.3
U.S. Leading Economic Indicators for January – (0.3%) vs. consensus (0.2%) and prior 0.1%
S&P Flash U.S. Services PMI for February – 49.7 vs. consensus 52.6 and prior 52.9
S&P Flash U.S. Manufacturing PMI for February – 51.6 vs. consensus 50.7 and prior 51.2
Consumer Sentiment for February – 64.7 vs. consensus 67.8 and prior 67.8
Existing Home Sales for January – 4.08M vs. consensus 4.13M and prior 4.24M
Major Macro Updates Scheduled for the Upcoming Week (Ended Feb. 28, 2025)
Monday, Feb. 24
None to Note
Tuesday, Feb. 25
S&P Case-Shiller Home Price Index (Dec.) – prior 4.3%
Consumer Confidence (Feb.) – consensus 102.4 and prior 104.1
Wednesday, Feb. 26
New Home Sales (Jan.) – consensus 674k and prior 698k
Thursday, Feb. 27
Initial jobless claims (week ended Feb. 22) – consensus 225k and prior 219k
Durable Goods Orders (Jan.) – consensus 1.9% and prior (2.2%)
GDP Second Revision (4Q24) – consensus 2.3% and prior 2.3%
Pending Home Sales (Jan.) – consensus (2.0%) and prior (5.5%)
Friday, Feb. 28
Personal Income (Jan.) – consensus 0.5% and prior 0.4%
Personal Spending (Jan.) – consensus 0.2% and prior 0.7%
PCE Index Y/Y (Jan.) – consensus 2.4% and prior 2.6%
Core PCE Index Y/Y (Jan.) – consensus 2.6% and prior 2.8%
Advanced U.S. Trade Balance in Goods (Jan.) – prior ($122.5B)
Advanced Retail Inventories (Jan.) – prior (0.3%)
Advanced Wholesale Inventories (Jan.) – prior (0.5%)
Chicago Business Barometer (Feb.) – consensus 41.1 and prior 39.5
Exchange Volume Update
Exchange Volumes Over Past Week and W/W Trends
Note: The week ended February 21, 2025 included the Presidents’ Day Holiday across U.S. markets so most ADV calcs for the past week are based on a four day trading week.
For the week ended February 21, 2025, volumes generally increased week over week, as volatility metrics were mainly higher due to macro concerns to close out the week.
The average VIX for the week was up 4% from the prior week, average realized volatility was down 10% W/W, average volatility of volatility (as measured by the VVIX) was up 7% W/W and the average MOVE index (U.S. Treasuries volatility) was up 1% W/W.
Futures average daily volumes (ADV) increased as CBOE futures volumes were up 25% W/W, CME futures volumes were up 23% W/W, and ICE futures volumes were up 2% W/W.
Total U.S. Equities ADV was up 1% W/W, mainly driven by on-exchange trading as TRF volumes were essentially flat W/W. Industry equity options volumes were up 18% W/W while index options volumes increased 27% W/W.
For further detail on weekly volume trends by exchange and by product line please see the charts below.
CME Futures Volumes (M)

Source: Company Daily Volume Releases
ICE Futures (M), U.S. Equities (B) and U.S. Equity Options (M) Volumes

Source: Company Daily Volume Releases, Cboe Global Markets and OCC
CBOE Options (M), Futures (K), U.S. Equity (B), and FX Volumes ($B)
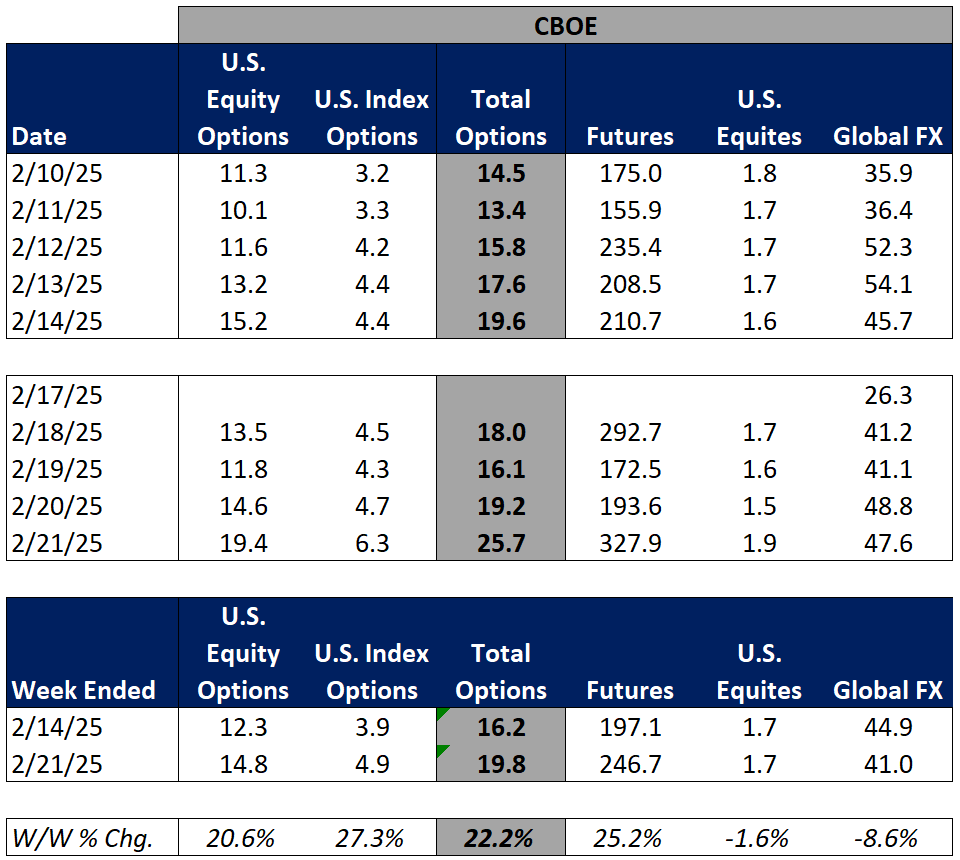
Source: Company Daily Volume Releases and OCC
NDAQ U.S. Equity (B) and Option (M) Volumes
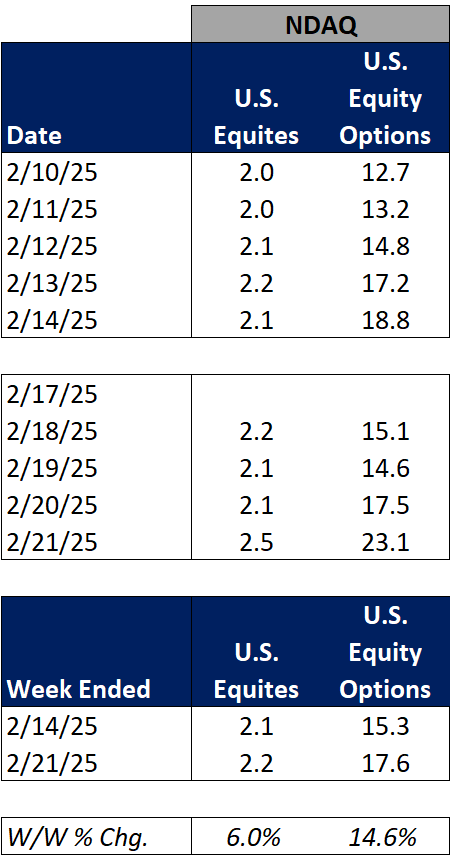
Source: Cboe Global Markets and OCC
U.S. Total Industry Equity Volumes (B)

Source: Cboe Global Markets
U.S. Total Industry Equity Option and Index Option Volumes (M)
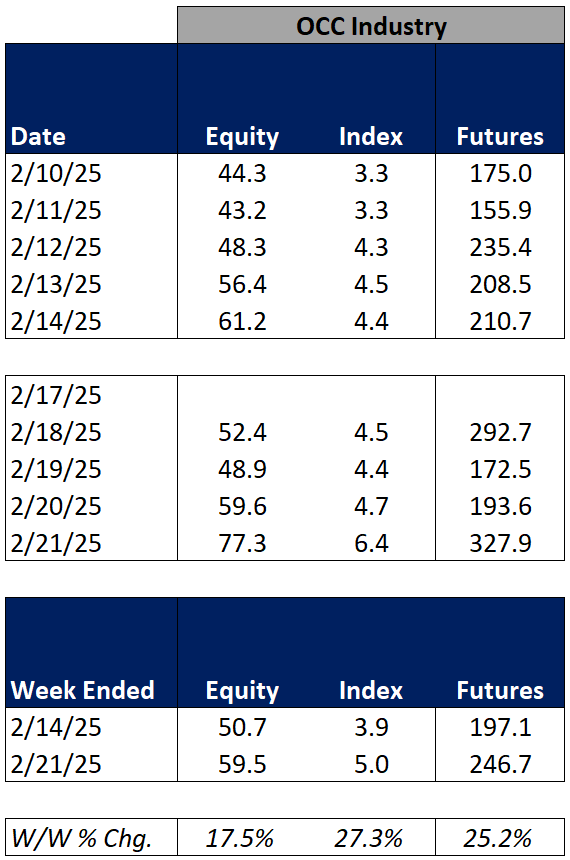
Source: OCC
Volatility Metrics
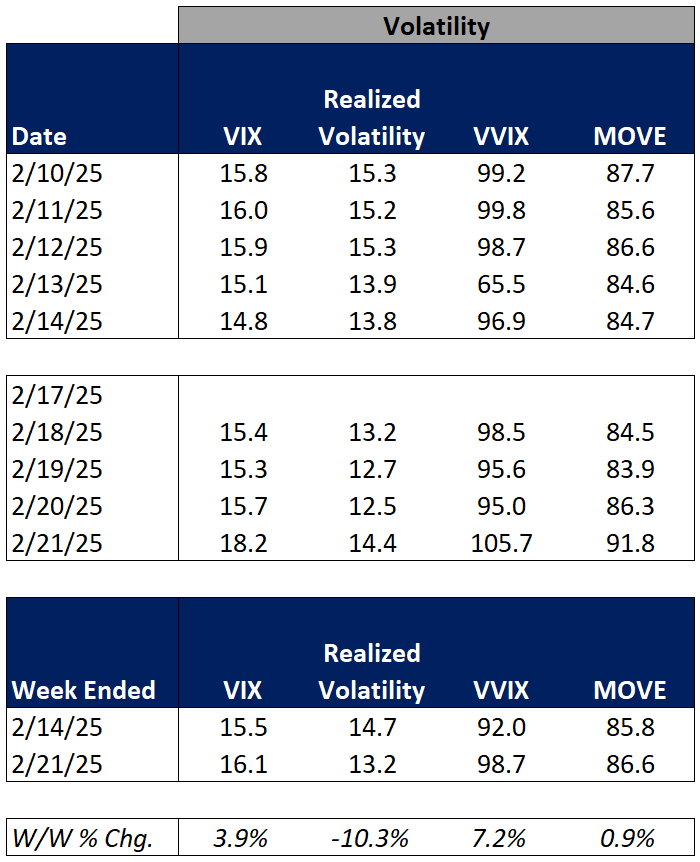
Source: Yahoo Finance
Exchange Volumes MTD / QTD / YTD Trends
Exchange volumes are tracking mainly higher in February-to-date. This comes as volatility is mixed MTD on a Y/Y basis.
The average VIX in February-to-date is up 16% Y/Y while realized volatility is down 1% Y/Y and volatility of volatility is up 18% Y/Y. Treasuries volatility is lower Y/Y as the average MOVE index in February-to-date is down 20% Y/Y.
Futures volumes are somewhat mixed as ICE futures MTD ADV is up 18% vs. February 2024 ADV. Meanwhile, CME ADV is down 4% Y/Y while CBOE futures ADV is up 3% Y/Y.
In terms of equities and options volumes, total U.S. equities ADV is up 31% MTD while option volumes are up 20% for equity options and up 5% for index options.
For further details on MTD / QTD and YTD ADV please see the charts below.
CME Futures Volumes (M)

Source: Company Daily Volume Releases
ICE Futures (M), U.S. Equities (B) and U.S. Equity Options (M) Volumes

Source: Company Daily Volume Releases, Cboe Global Markets and OCC
CBOE Options (M), Futures (K), U.S. Equity (B), and FX Volumes ($B)
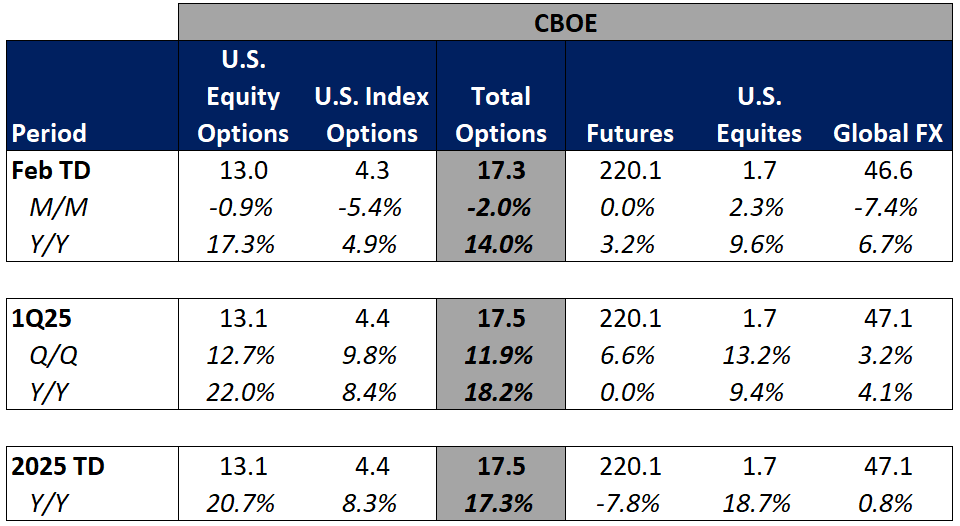
Source: Company Daily Volume Releases and OCC
NDAQ U.S. Equity (B) and Option (M) Volumes
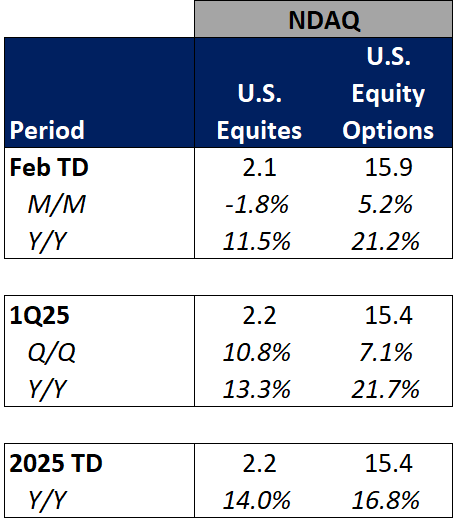
Source: Cboe Global Markets and OCC
U.S. Total Industry Equity Volumes (B)

Source: Cboe Global Markets
U.S. Total Industry Equity Option and Index Option Volumes (M)

Source: OCC
Volatility Metrics

Source: Yahoo Finance
Major Indices, Interest Rates and Company Share Price Trends
Markets ended the week on a softer note with the S&P down 170bps W/W. Friday saw a broad based sell-off as economic concerns weighed on sentiment driven by mixed housing data, some concerns coming from the retail sector on soft Walmart guidance and continued concerns over the impact of tariffs on the economic outlook.
In terms of the companies I follow, HOOD showed the softest performance (-21%), giving back all of the gains the shares saw in the wake of its strong earnings release in the prior week. Within the exchanges, CBOE showed strongest performance, closing out the week up 4%, as volatility increased with the growing economic concerns. On the Fixed Income Trading Platform side, TW performed well on limited micro news in the week.
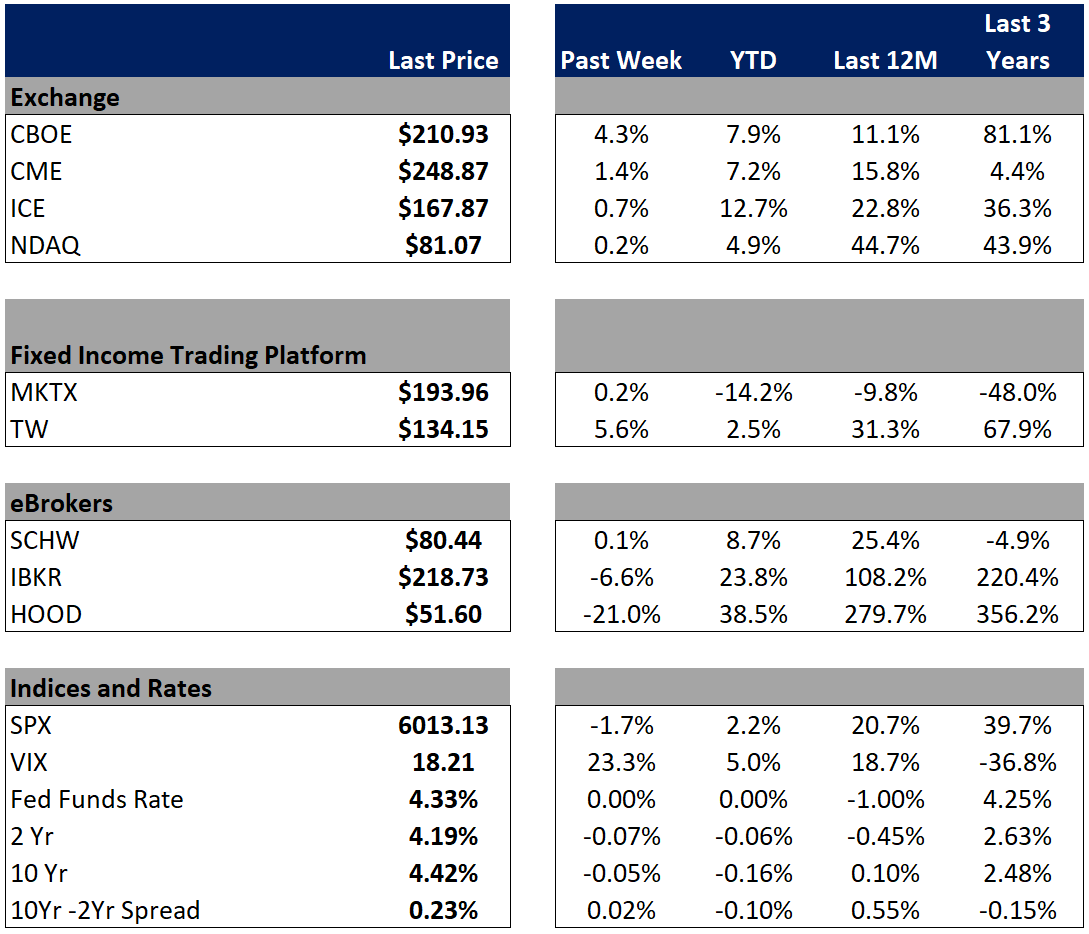
Source: Yahoo Finance, FRED, U.S. Department of the Treasury
Comp Sheet
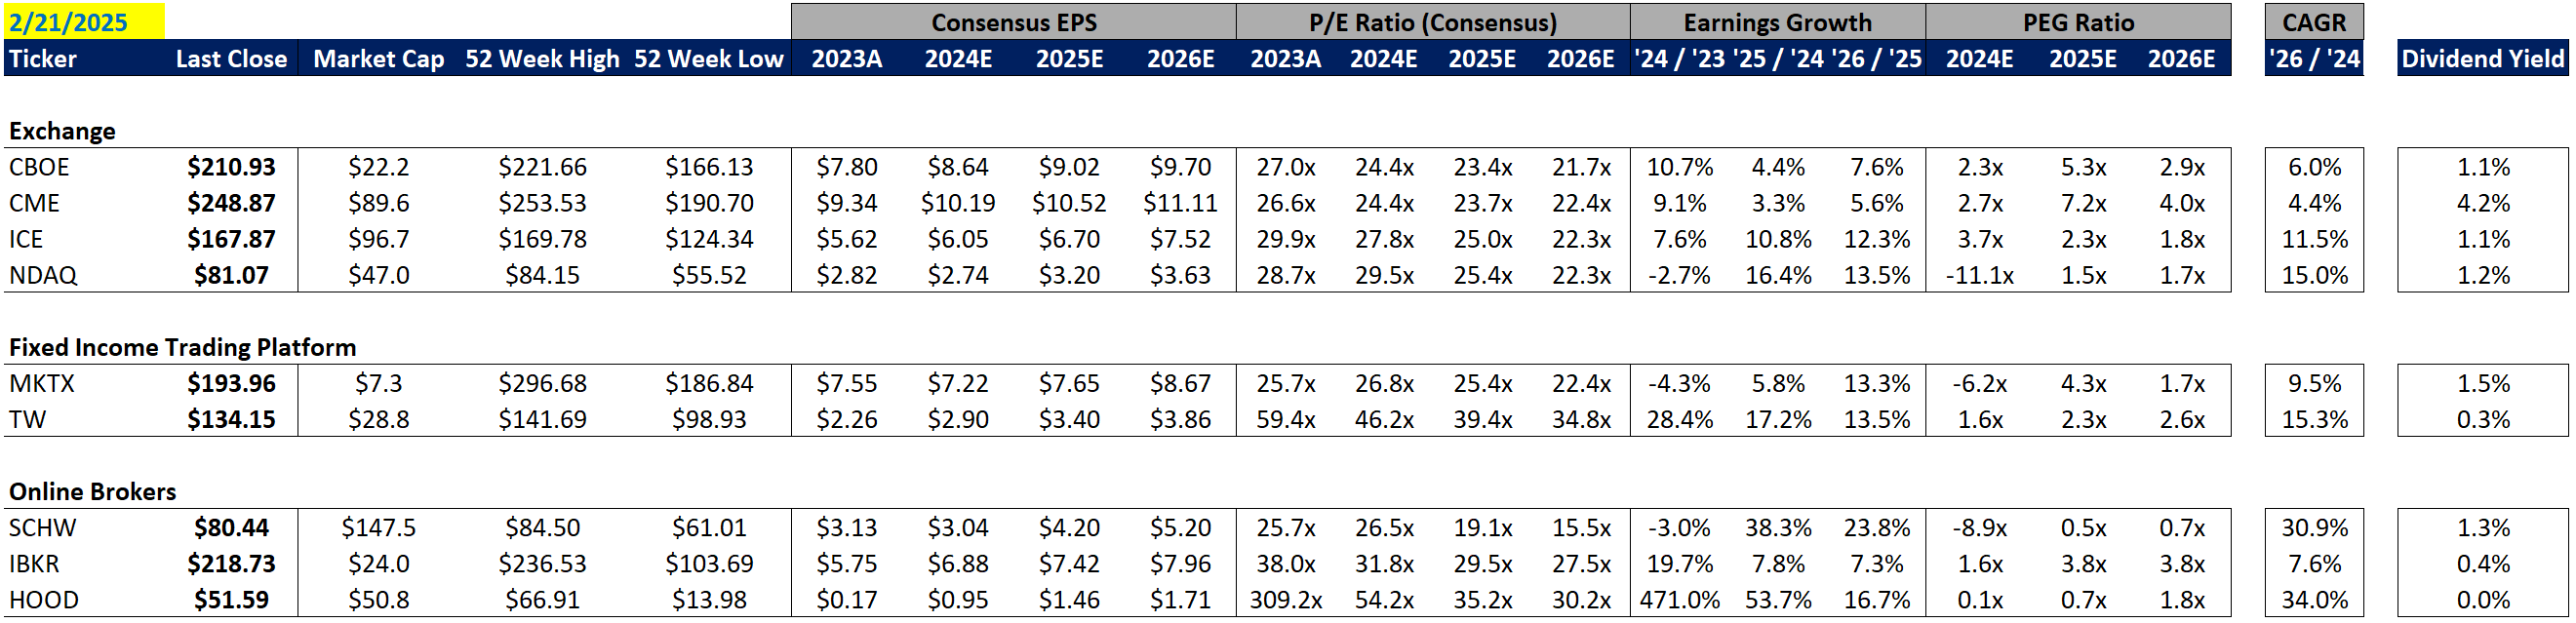
Source: PitchBook
Guidance Tracker
Exchanges
Cboe Global Markets, Inc. (CBOE)

Source: Company documents
Note: CBOE provided additional guidance points / commentary on its 4Q24 earnings call, but key annual highlights are included above for the sake of simplicity
CME Group Inc. (CME)

Source: Company documents
Note: CME provided additional guidance points / commentary on its 4Q24 earnings call, but key annual highlights are included above for the sake of simplicity
Intercontinental Exchange, Inc. (ICE)

Source: Company documents
Note: ICE provided additional guidance points / commentary on its 4Q24 earnings call, but key annual highlights are included above for the sake of simplicity
Nasdaq, Inc. (NDAQ)

Source: Company documents
Note: NDAQ provided additional guidance points / commentary on its 4Q24 earnings call, but key annual highlights are included above for the sake of simplicity
Fixed Income Trading Platforms
MarketAxess Holdings Inc. (MKTX)

Source: Company documents
Note: MKTX provided additional guidance points / commentary on its 4Q24 earnings call, but key annual highlights are included above for the sake of simplicity
Tradeweb Markets Inc. (TW)

Source: Company documents
Note: TW provided additional guidance points / commentary on its 4Q24 earnings call, but key annual highlights are included above for the sake of simplicity
Online Brokers
The Charles Schwab Corporation (SCHW)
