


Weekly Recap for Week Ended April 4, 2025
Weekly Recap of Major Micro / Macro Data Points and Things to Look Forward to in the Week Ahead

Significant News / Developments from Week Ended Apr. 4, 2025
U.S. Equities Volumes Reach Record Level on Friday
Amidst all of the market volatility on Thursday and Friday, U.S. equities volumes hit a record level based on shares traded at 26.9 billion. This was 10% higher than the previous high set on January 27, 2021 amidst the meme stock mania and hedge fund short squeeze and 70% higher than the YTD average of 15.8 billion. Notably for the exchanges, on exchange trading amounted to 55% of total volume on Friday which was the highest level year to date outside of triple witching on Friday, March 21.
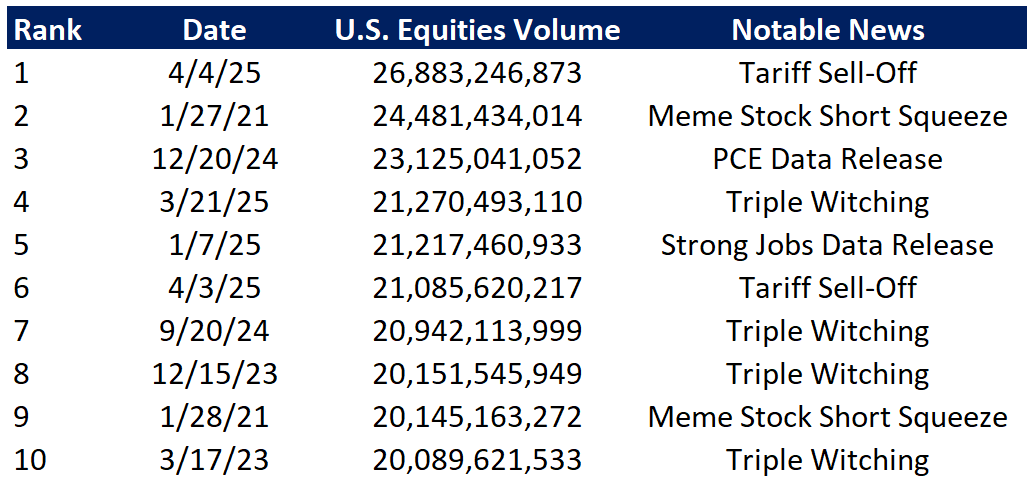
Source: Cboe Global Markets
This uptick in market volatility has come as a boon to the exchanges’ transaction businesses (as noted in my March monthly volume recap from last week) as has been reflected in share prices of the exchanges that are more levered to trading activity. Since the market reached its peak on February 19, the S&P 500 has fallen 17% meanwhile CBOE 0.00%↑ and CME 0.00%↑ are up 2% and 1%, respectively while ICE 0.00%↑ is down 6% and NDAQ 0.00%↑ has fallen 17%. For the exchanges, CME is most levered to transaction activity at 80% of net revenue, followed by CBOE at 60%, ICE at 40% and NDAQ at 25%.
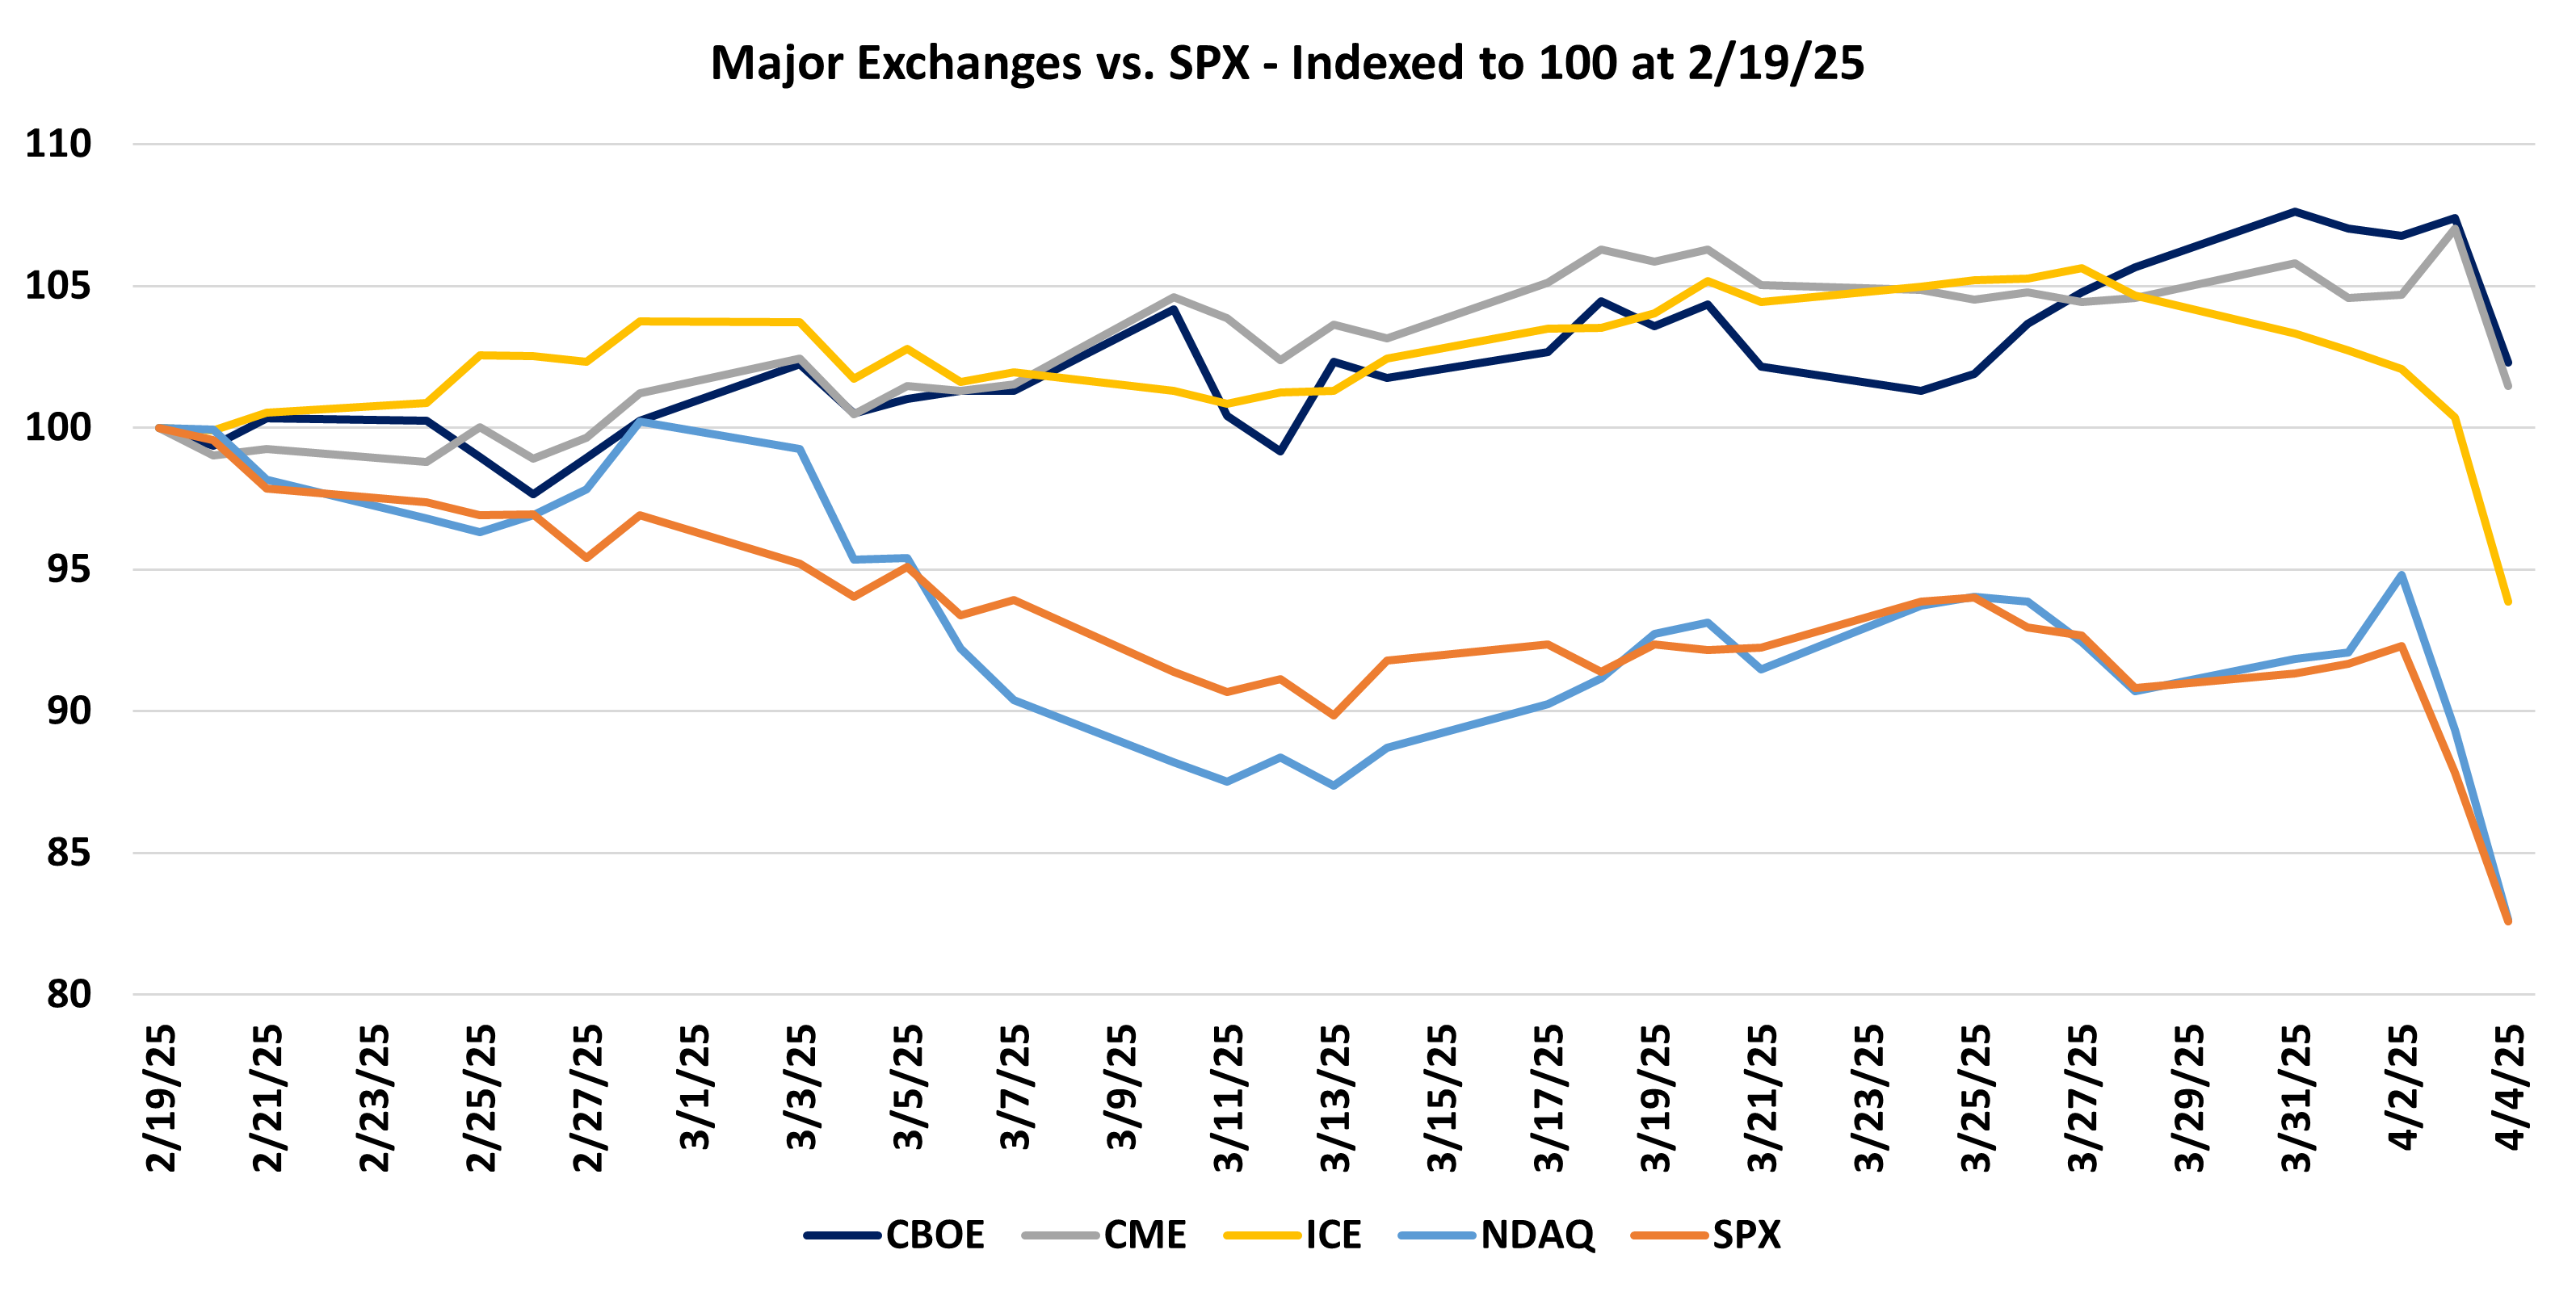
Source: Yahoo Finance
Company Specific Updates for Week Ended Apr. 4, 2025
Exchanges
Cboe Global Markets, Inc. (CBOE)
Cboe Clear Europe Clears First Securities Financing Transactions
launches clearing service for European SFTs in cash equities and ETFs
Natixis CIB and JP Morgan among first participants to use new service
Introduced to meet strong client demand for central clearing of SFTs, enhancing capital, operational and post-trade processing efficiencies amid evolving regulatory requirements
Reports Trading Volume for March
While volumes were largely known ahead of the release (as mentioned in my post from Tuesday) rate per contract (RPC) detail was the new information in this release
RPC’s were a mixed relative to the RPCs posted for 4Q24, though in general were stronger than anticipated, particularly for CBOE’s proprietary products which make up a larger part of the revenue picture
Previously I mentioned that I expected about $0.23 EPS upside related to volume strength. Given solid RPC trends for the month I’m now forecasting EPS for the quarter of $2.54 (up $0.44 vs. the prior quarter).
I continue to view the stock favorably given the volatility in the macro backdrop and the potential for volumes to remain elevated and/or increase from here
CME Group Inc. (CME)
Producer sentiment slips due to rising policy uncertainty
The Purdue University/CME Group Ag Economy Barometer fell 12 points to 140, down from 152 last month
Will allow investors to trade futures positions in spot-market terms (price quoted on financial media and investment sites)
Contracts can be heled for up to five years without needing to roll
Will be available for bitcoin, ether, S&P 500, Nasdaq-100 Russell 2000 and the DJIA
Targeted at retail traders to make trading longer term positions easier
Another example of the retail trader directing where the market is headed
Reports Quarterly ADV Record of 29.8M Contracts
While volumes were largely known ahead of the release (as mentioned in my post from Tuesday) rate per contract (RPC) detail was the new information in this release
RPC’s broadly performed strongly with the overall RPC for February essentially flat M/M
In terms of RPC by product, rates increased 0.6% M/M, equities fell 1.7% M/M, energy rpse 0.7% M/M, FX rose 0.7% M/M, ags rose 0.7% M/M and metals increased 2.5% M/M
Recall that on its 4Q24 earnings call CME noted that pricing changes on transaction fees announced in December would take effect in February and could lead to a 1.0-1.5% increase in transaction fees (all else equal) so the M/M increase was nice to see, particularly given volume strength in the month (typically RPC can come under pressure when volume increases dramatically)
Previously I mentioned that I expected about $0.22 EPS upside related to volume strength. Given solid RPC trends for the month I’m now forecasting EPS for the quarter of $2.82 (up $0.30 vs. the prior quarter).
I continue to view the stock favorably given the volatility in the macro backdrop and the potential for volumes to remain elevated and/or increase from here
Nasdaq, Inc. (NDAQ)
Verisk Acquires NDAQ Risk Modeling for Catastrophes
No financial terms disclosed
Transaction not expected to materially impact financial results for NDAQ
Intercontinental Exchange, Inc. (ICE)
Trump Media & Technology Group becomes first corporate issuer on the new exchange under the symbol DJT
In the press release ICE noted Texas is home to the largest number of companies listed on NYSE with $3.7T in aggregate market value
Annual Stockholders’ Meeting Scheduled for May 16 at 8:30am ET
While volumes were largely known ahead of the release (as mentioned in my post from Tuesday) rate per contract (RPC) detail was the new information in this release
RPC’s were mixed, though generally better than expected for the quarter given the volume strength
Previously I mentioned that I expected about $0.14 EPS upside related to volume strength. Given solid RPC trends for the month I’m now forecasting EPS for the quarter of $1.70 (up $0.18 vs. the prior quarter).
I’m a bit more cautious on shares of ICE (relative to CBOE and CME) currently as the macro backdrop makes me concerned about a rebound in mortgage activity, which could continue to drag down the performance of ICE’s mortgage technology business (~20% of revenue)
Fixed Income Trading Platforms
Tradeweb Markets Inc. (TW)
Total ADV came in at a record $2.7T (+50% Y/Y)
Total rates ADV came in at $1.6T (+38% Y/Y)
Total credit ADV came in at $80.9B (+52% Y/Y)
USHG fully electronic market share came in at 18.4% (+30bps Y/Y)
USHY fully electronic market share came in at 7.6% (+130 bps Y/Y)
Total equities ADV came in at $$28.6B (-3% Y/Y)
Total money markets ADV came in at $1.0T (+74% Y/Y)
Average preliminary fee per million came in at $2.31 (+2% Q/Q, -10% Y/Y)
Fixed fees across rates, credit, equities and money markets came in at $85.1M (+4% Q/Q, +14% Y/Y)
Based on these results, I’m forecasting $0.88 in EPS for 1Q25, a bit above the consensus at $0.85
MarketAxess Holdings Inc. (MKTX)
Reports March Trading Volumes and 1Q25 Fee Per Million Statistics
Reported record March total credit ADV of $17.8B (+15% M/M, +20% Y/Y)
Reported total March rates ADV of $28.7B (+3% M/M, +69% Y/Y)
MKTX attributed the improvement in performance to the enhancements it’s made to its portfolio trading solution, the launch of High Touch block trading solution in Eurobonds and EM and its dealer solutions offering
USHG market share increased 220bps M/M to 19.2% (down 10bps Y/Y)
While market share was still down Y/Y this was a much slower pace of decline than we’ve seen the past 5 months
USHY market share increased 140bps M/M to 12.5% (down 20bps Y/Y)
While market share was still down Y/Y this was a much slower pace of decline than we’ve seen in the past 21 (yes 21) months
Fee Per Million came in at $140 for credit (-7% Q/Q, -9% Y/Y) and $4.32 for rates (flat Q/Q, -10% Y/Y)
MKTX attributed the deterioration to product and protocol mix
Based on these results, I’m forecasting $1.85 in EPS for 1Q25, a bit above the consensus at $1.80
Online Brokers
Robinhood Markets, Inc. (HOOD)
Announced 1Q25 Earnings Conference Call
Wednesday April 30 at 5:00pm ET
Interactive Brokers Group, Inc. (IBKR)
DARTs came in at 3.5M (+44% Y/Y)
Client accounts rose 32% Y/Y to 3.6M
Client equity increased 23% Y/Y to $574B
Margin loans came in at $64B (+24% Y/Y)
Adds Multi-Monitor Support to IBKR Desktop Trading Platform
Updates include:
Ability to view multiple IBKR Desktop monitors
Use of forecast contracts to trade predictions on political, economic, and climate events
Ability to trade over 10k U.S. stocks, ETFs and equity index futures around the clock
Screeners and alerts / notifications
Company Specific Updates Anticipated for the Upcoming Week (Ended Apr. 11, 2025)
Exchanges
Nasdaq, Inc. (NDAQ)
March volume release anticipated Monday, April 7 (post-close)
Fixed Income Trading Platforms
None to Note
Online Brokers
None to Note
Next Four Weeks Calendar

Source: Company press releases and my estimates around timing
Major Macro Updates for Week Ended Apr. 4, 2025
Chicago Business Barometer (Mar.) – 47.6 vs. consensus 43.6 and prior 45.5
S&P Final U.S. Manufacturing PMI (Mar.) – 50.2 vs. consensus 49.8 and prior 49.8
Construction Spending (Feb.) – 0.7% vs. consensus 0.3% and prior (0.5%)
ISM Manufacturing (Mar.) – 49.0% vs. consensus 49.5% and prior 50.3%
Job Openings (Feb.) – 7.6M vs. consensus 7.7M and prior 7.7M
Auto Sales (Mar.) – 17.8M vs. prior 16.0M
ADP Employment (Mar.) – 155k vs. consensus 120k and prior 84k
Factory Orders (Feb.) – 0.6% vs. consensus 0.6% and prior 1.8%
Initial jobless claims (week ended Mar. 29) – 219k vs. consensus 228k and prior 225k
U.S. Trade Deficit (Feb.) – $122.7B vs. consensus $123.4B and prior $130.7B
S&P Final U.S. Services PMI (Mar.) – 54.4 vs. consensus 54.2 and prior 54.3
ISM Services (Mar.) – 50.8% vs. consensus 52.9% and prior 53.5%
U.S. Employment Report (Mar.) – 228k vs. consensus 140k and prior 151k
U.S. Unemployment Rate (Mar.) – 4.2% vs. consensus 4.1% and prior 4.1%
U.S. Hourly Wages (Mar.) – 0.3% vs. consensus 0.3% and prior 0.2%
Hourly Wages Year over Year (Mar.) – 3.8% vs. consensus 3.9% and prior 4.0%
Major Macro Updates Scheduled for the Upcoming Week (Ended Apr. 11, 2025)
Monday, Apr. 7
Consumer Credit (Feb.) – consensus $15.5B and prior $18.1B
Tuesday, Apr. 8
NFIB Optimism Index (Mar.) – prior 100.7
Wednesday, Apr. 9
Wholesale Inventories (Feb.) – consensus 0.4% and prior 0.8%
Minutes from March FOMC meeting released
Thursday, Apr. 10
Initial jobless claims (week ended Apr. 5) – prior 219k
CPI (Mar.) – consensus 0.1% and prior 0.2%
CPI Y/Y (Mar.) – consensus 2.5% and prior 2.8%
Core CPI (Mar.) – consensus 0.3% and prior 0.2%
Core CPI Y/Y (Mar.) – consensus 3.0% and prior 3.1%
Monthly U.S. Federal Budget (Mar.) – prior $236B
Friday, Apr. 11
PPI (Mar.) – consensus 0.2% and prior 0.0%
Core PPI (Mar.) – prior 0.2%
PPI Y/Y (Mar.) – prior 3.2%
Core PPI Y/Y (Mar.) – prior 3.3%
Prelim. Consumer Sentiment (Apr.) – consensus 55.0 and prior 57.0
Exchange Volume Update
Exchange Volumes Over Past Week and W/W Trends
For the week ended April 4, 2025, volumes and volatility were both significantly higher week over week.
The average VIX for the week was up 51% from the prior week, average realized volatility was up 13% W/W, average volatility of volatility (as measured by the VVIX) was up 29% W/W and the average MOVE index (U.S. Treasuries volatility) was up 18% W/W.
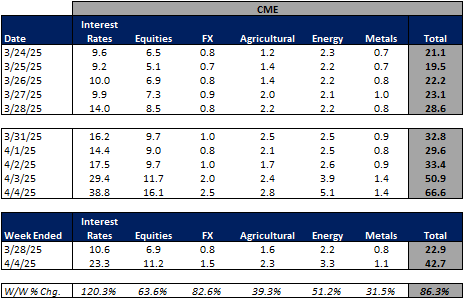
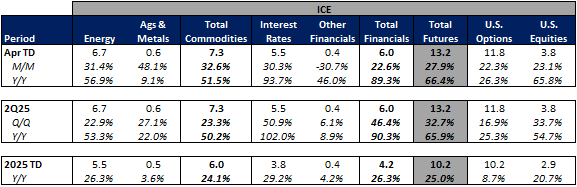
Futures average daily volumes (ADV) increased substantially as CBOE futures volumes were up 106% W/W, CME futures volumes were up 86% W/W, and ICE futures volumes were up 40% W/W.
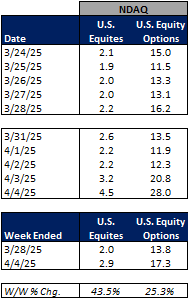
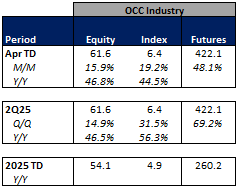
Total U.S. Equities ADV was up 33%W/W, mainly driven by on-exchange trading as TRF volumes were up 27% W/W. Industry equity options volumes were up 23% W/W while index options volumes increased 29% W/W.
For further detail on weekly volume trends by exchange and by product line please see the charts below.
CME Futures Volumes (M)
Source: Company Daily Volume Releases
ICE Futures (M), U.S. Equities (B) and U.S. Equity Options (M) Volumes

Source: Company Daily Volume Releases, Cboe Global Markets and OCC
CBOE Options (M), Futures (K), U.S. Equity (B), and FX Volumes ($B)

Source: Company Daily Volume Releases and OCC
NDAQ U.S. Equity (B) and Option (M) Volumes
Source: Cboe Global Markets and OCC
U.S. Total Industry Equity Volumes (B)
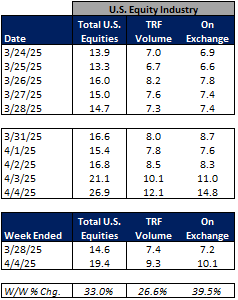
Source: Cboe Global Markets
U.S. Total Industry Equity Option and Index Option Volumes (M)

Source: OCC
Volatility Metrics

Source: Yahoo Finance
Exchange Volumes MTD / QTD / YTD Trends
Exchange volumes are tracking higher in April-to-date. This comes as volatility is up significantly MTD on a Y/Y basis.
The average VIX in April-to-date is up 84% Y/Y while realized volatility is up 120% Y/Y and volatility of volatility is up 36% Y/Y. Treasuries volatility is higher as well Y/Y as the average MOVE index in April-to-date is up 6% Y/Y.
Futures volumes are higher Y/Y as ICE futures MTD ADV is up 66% vs. April 2024 ADV. Meanwhile, CME ADV is up 71% Y/Y while CBOE futures ADV is up 36% Y/Y.
In terms of equities and options volumes, total U.S. equities ADV is up 83% MTD while option volumes are up 47% for equity options and up 45% for index options.
For further details on MTD / QTD and YTD ADV please see the charts below.
CME Futures Volumes (M)

Source: Company Daily Volume Releases
ICE Futures (M), U.S. Equities (B) and U.S. Equity Options (M) Volumes
Source: Company Daily Volume Releases, Cboe Global Markets and OCC
CBOE Options (M), Futures (K), U.S. Equity (B), and FX Volumes ($B)

Source: Company Daily Volume Releases and OCC
NDAQ U.S. Equity (B) and Option (M) Volumes

Source: Cboe Global Markets and OCC
U.S. Total Industry Equity Volumes (B)

Source: Cboe Global Markets
U.S. Total Industry Equity Option and Index Option Volumes (M)
Source: OCC
Volatility Metrics

Source: Yahoo Finance
Major Indices, Interest Rates and Company Share Price Trends
Well that sucked! Markets ended the week down significantly in an extremely volatile trading environment with the S&P down 9% after falling 5% on Thursday and 6% on Friday. The week was characterized by Trump’s tariff announcement on Wednesday after the market closed which stoked significant fear about the potential for a global trade war. These fears were justified as China announced retaliatory tariffs on the U.S. ahead of market open on Friday. At present there is a ton of stagflation fear in the market (which is likely justified). Notably, on Friday, Fed Chair Powell stated that he was going to be patient on reacting to the tariff announcements as the economy is currently in good shape and the inflationary impact of tariffs could be “transitory” (scary word coming from the Fed).
In terms of the companies I follow, MKTX showed the strongest performance as volatility tends to benefit its transaction based revenue, plus the company reported solid monthly metrics on Friday morning. Within the exchange space, CME and CBOE performed the best, falling only 3% (all of which occurred on Friday) as the volatility in the market is generally beneficial for these heavily transaction based businesses. Within the online broker space, SCHW and IBKR performed the “best” falling only 11% vs. HOOD falling 18% for the week as a general weakening in the economy and falling markets are unfavorable for their business.

Source: Yahoo Finance, FRED, U.S. Department of the Treasury
Comp Sheet

Source: PitchBook
Guidance Tracker
Exchanges
Cboe Global Markets, Inc. (CBOE)

Source: Company documents
Note: CBOE provided additional guidance points / commentary on its 4Q24 earnings call, but key annual highlights are included above for the sake of simplicity
CME Group Inc. (CME)

Source: Company documents
Note: CME provided additional guidance points / commentary on its 4Q24 earnings call, but key annual highlights are included above for the sake of simplicity
Intercontinental Exchange, Inc. (ICE)

Source: Company documents
Note: ICE provided additional guidance points / commentary on its 4Q24 earnings call, but key annual highlights are included above for the sake of simplicity
Nasdaq, Inc. (NDAQ)

Source: Company documents
Note: NDAQ provided additional guidance points / commentary on its 4Q24 earnings call, but key annual highlights are included above for the sake of simplicity
Fixed Income Trading Platforms
MarketAxess Holdings Inc. (MKTX)

Source: Company documents
Note: MKTX provided additional guidance points / commentary on its 4Q24 earnings call, but key annual highlights are included above for the sake of simplicity
Tradeweb Markets Inc. (TW)

Source: Company documents
Note: TW provided additional guidance points / commentary on its 4Q24 earnings call, but key annual highlights are included above for the sake of simplicity
Online Brokers
The Charles Schwab Corporation (SCHW)
