


Market Volumes Have Set Numerous Records; Exchanges Levered To Trading Should Be Loving It
Thoughts on The Exchange Company Shares and Earnings Potential in The Wake of Market Volatility Spike and Putting Equity Market Volumes Into Context

Recent Market Action Has Truly Been Astounding
The past 5 trading sessions following President Trump’s “Liberation Day” tariff announcement have been an absolute rollercoaster in financial markets with individual tweets sending broad indices higher or lower, seemingly on a whim, and the overall U.S. market trading like a meme stock. In the immediate wake of the announcement, the S&P fell 4.8% on Thursday, April 3 followed by a 6.0% decline on Friday, April 4, a 0.2% decline on Monday, April 7 and a 1.6% decline on Tuesday, April 8. And then on Wednesday, April 9, President Trump announced a 90-day delay to tariff implementation to allow time for trade negotiations to occur which sent the S&P rocketing higher, logging its 8th best day ever recorded, and the best single day of returns on a percentage basis since 1933.
Top 10 S&P 500 Percent Return Days
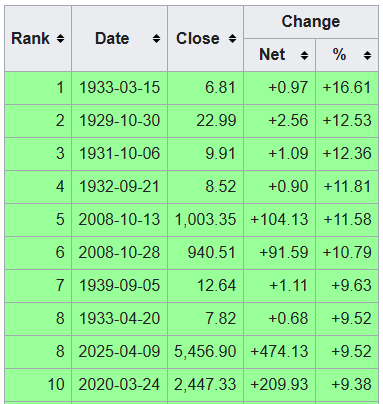
Source: Wikipedia
Amidst the equity market chaos, Treasury yields initially fell with the ten-year Treasury yield dropping from above 4.2% prior to “Liberation Day” to a low below 4.0% and then proceeded to rise, crossing above the 4.5% threshold at one point. Meanwhile, the dollar has come under pressure, oil has plummeted, the VIX breached the 50 threshold and markets across the globe have reacted with similar volatility spikes.
Given the extreme movements we have seen the past few days across all asset classes, the exchange companies with revenue composition that is levered to trading activity are set to see an uplift amidst the chaos.
Exchange Revenue Composition
Revenue composition varies greatly from exchange to exchange. In terms of exposure to transaction related revenue, CME has the largest exposure at 80% of the total net revenue pie. Next is CBOE at 60% of the mix followed by ICE at 40% of total net revenue. NDAQ has the least exposure to transaction fees at only 20% of the total.
Exchange Revenue Mix (2024A)
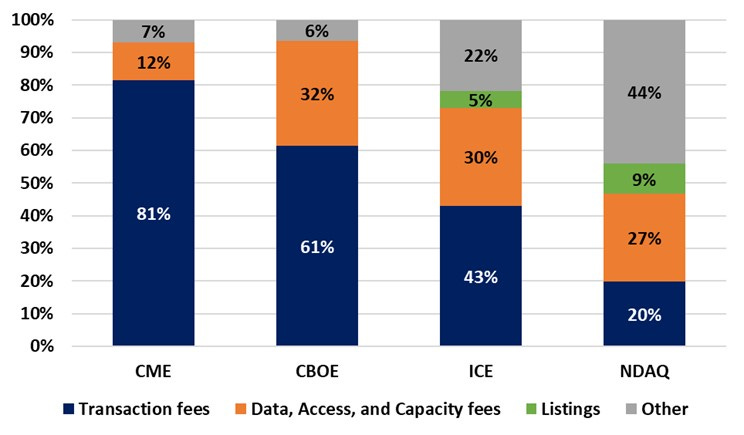
Source: CME, CBOE, ICE and NDAQ 10Ks and my estimates for revenue allocation
In terms of the breakdown of non-transaction related revenue lines, adding together market data and access and capacity fees, CBOE has the largest exposure at a little over 30% of the mix, followed by ICE at 30%, NDAQ at a bit under 30% and CME at about 10%. For ICE and NDAQ listings comprise 5% and 10% of total net revenues, respectively. This leaves room for ancillary revenues at CME and CBOE of <10%. However, ancillary revenues at ICE and NDAQ are a much larger piece of the pie at about 20% and 40%, respectively. For ICE, ancillary revenues are related to its mortgage technology business while at NDAQ ancillary revenues include financial technology revenue, index revenue and corporate data and analytics revenue related to investor relations and board management.
Recent Equity Market Volumes
The magnitude of the recent trading environment has been historic across numerous metrics. For the purposes of this discussion, I will primarily focus on the historic trading levels we have seen across the U.S. equity market, however, as mentioned above, trading activity has been outstanding across all asset classes.
Of the top 10 trading volume days in the history of the U.S. equities market in terms of number of shares traded, the past five sessions have all been in the top 10 with Wednesday, April 9 a record setting day with nearly 31B shares trading hands over the course of the day (a full 5% higher than the prior record, which was set just two days before). Furthermore, seven of the top 10 trading days have all occurred this year (and the year is only really just getting started with 67 trading days under our belt).
Top 10 Share Volume Days on U.S. Equity Markets
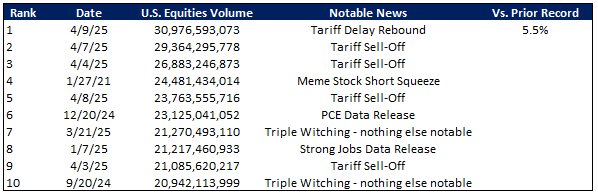
Source: Cboe Global Markets
What has been particularly interesting to see for the exchanges, is the recent bout of market volatility has lead to a massive shift in trading onto lit exchanges and away from off-exchange trading venues. On-exchange trading has averaged 60% since “Liberation Day” up from <55% leading up to the announcement.
On-Exchange vs. Off-Exchange Trading Share

Source: Cboe Global Markets
Additionally, on April 9, $1.6 trillion was traded across U.S. equity exchanges amongst the market rally following the announcement of reciprocal tariff delays. Similarly to the share volume traded stats above, five of the top ten notional value traded days have occurred in 2025 alone, four of which have occurred in the past 5 trading sessions. What has been particularly astounding about the past five days is average notional traded since “Liberation Day” has amounted to $1.3 trillion, which is a full 84% above the YTD average notional traded leading up to the reciprocal tariff announcement.
Top 10 Notional Volume Days on U.S. Equity Markets

Source: Cboe Global Markets
Volumes More Broadly
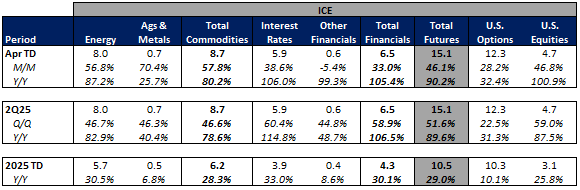
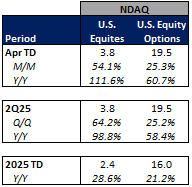
Moving beyond just equity share volumes traded, exchange volumes across the board are tracking up strongly Y/Y in April-to-date. For CME, total futures volumes are tracking up 94% Y/Y. At ICE, futures volumes are up 90% Y/Y and U.S. Option volumes are up 32% Y/Y. At CBOE, total option volumes are up 47% Y/Y, futures volumes are up 55% Y/Y and FX volumes are up 63% Y/Y. And at NDAQ option volumes are up 61% Y/Y.
CME Futures Volumes (M)
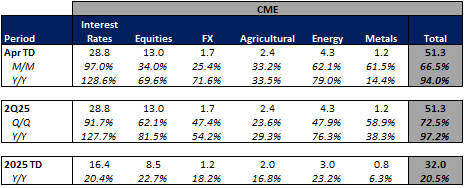
Source: Company Daily Volume Releases
ICE Futures (M), U.S. Equities (B) and U.S. Equity Options (M) Volumes
Source: Company Daily Volume Releases, Cboe Global Markets and OCC
CBOE Options (M), Futures (K), U.S. Equity (B), and FX Volumes ($B)
Source: Company Daily Volume Releases and OCC
NDAQ U.S. Equity (B) and Option (M) Volumes
Source: Cboe Global Markets and OCC
Given This Backdrop, Why are the Exchanges Trading the Way They Are?
The interesting thing about the recent market volatility is the exchange stocks have all declined since “Liberation Day”, despite arguably one of the best environments for their transaction-based businesses, with the exchange stocks down 8-13% since the close of trading on April 2.
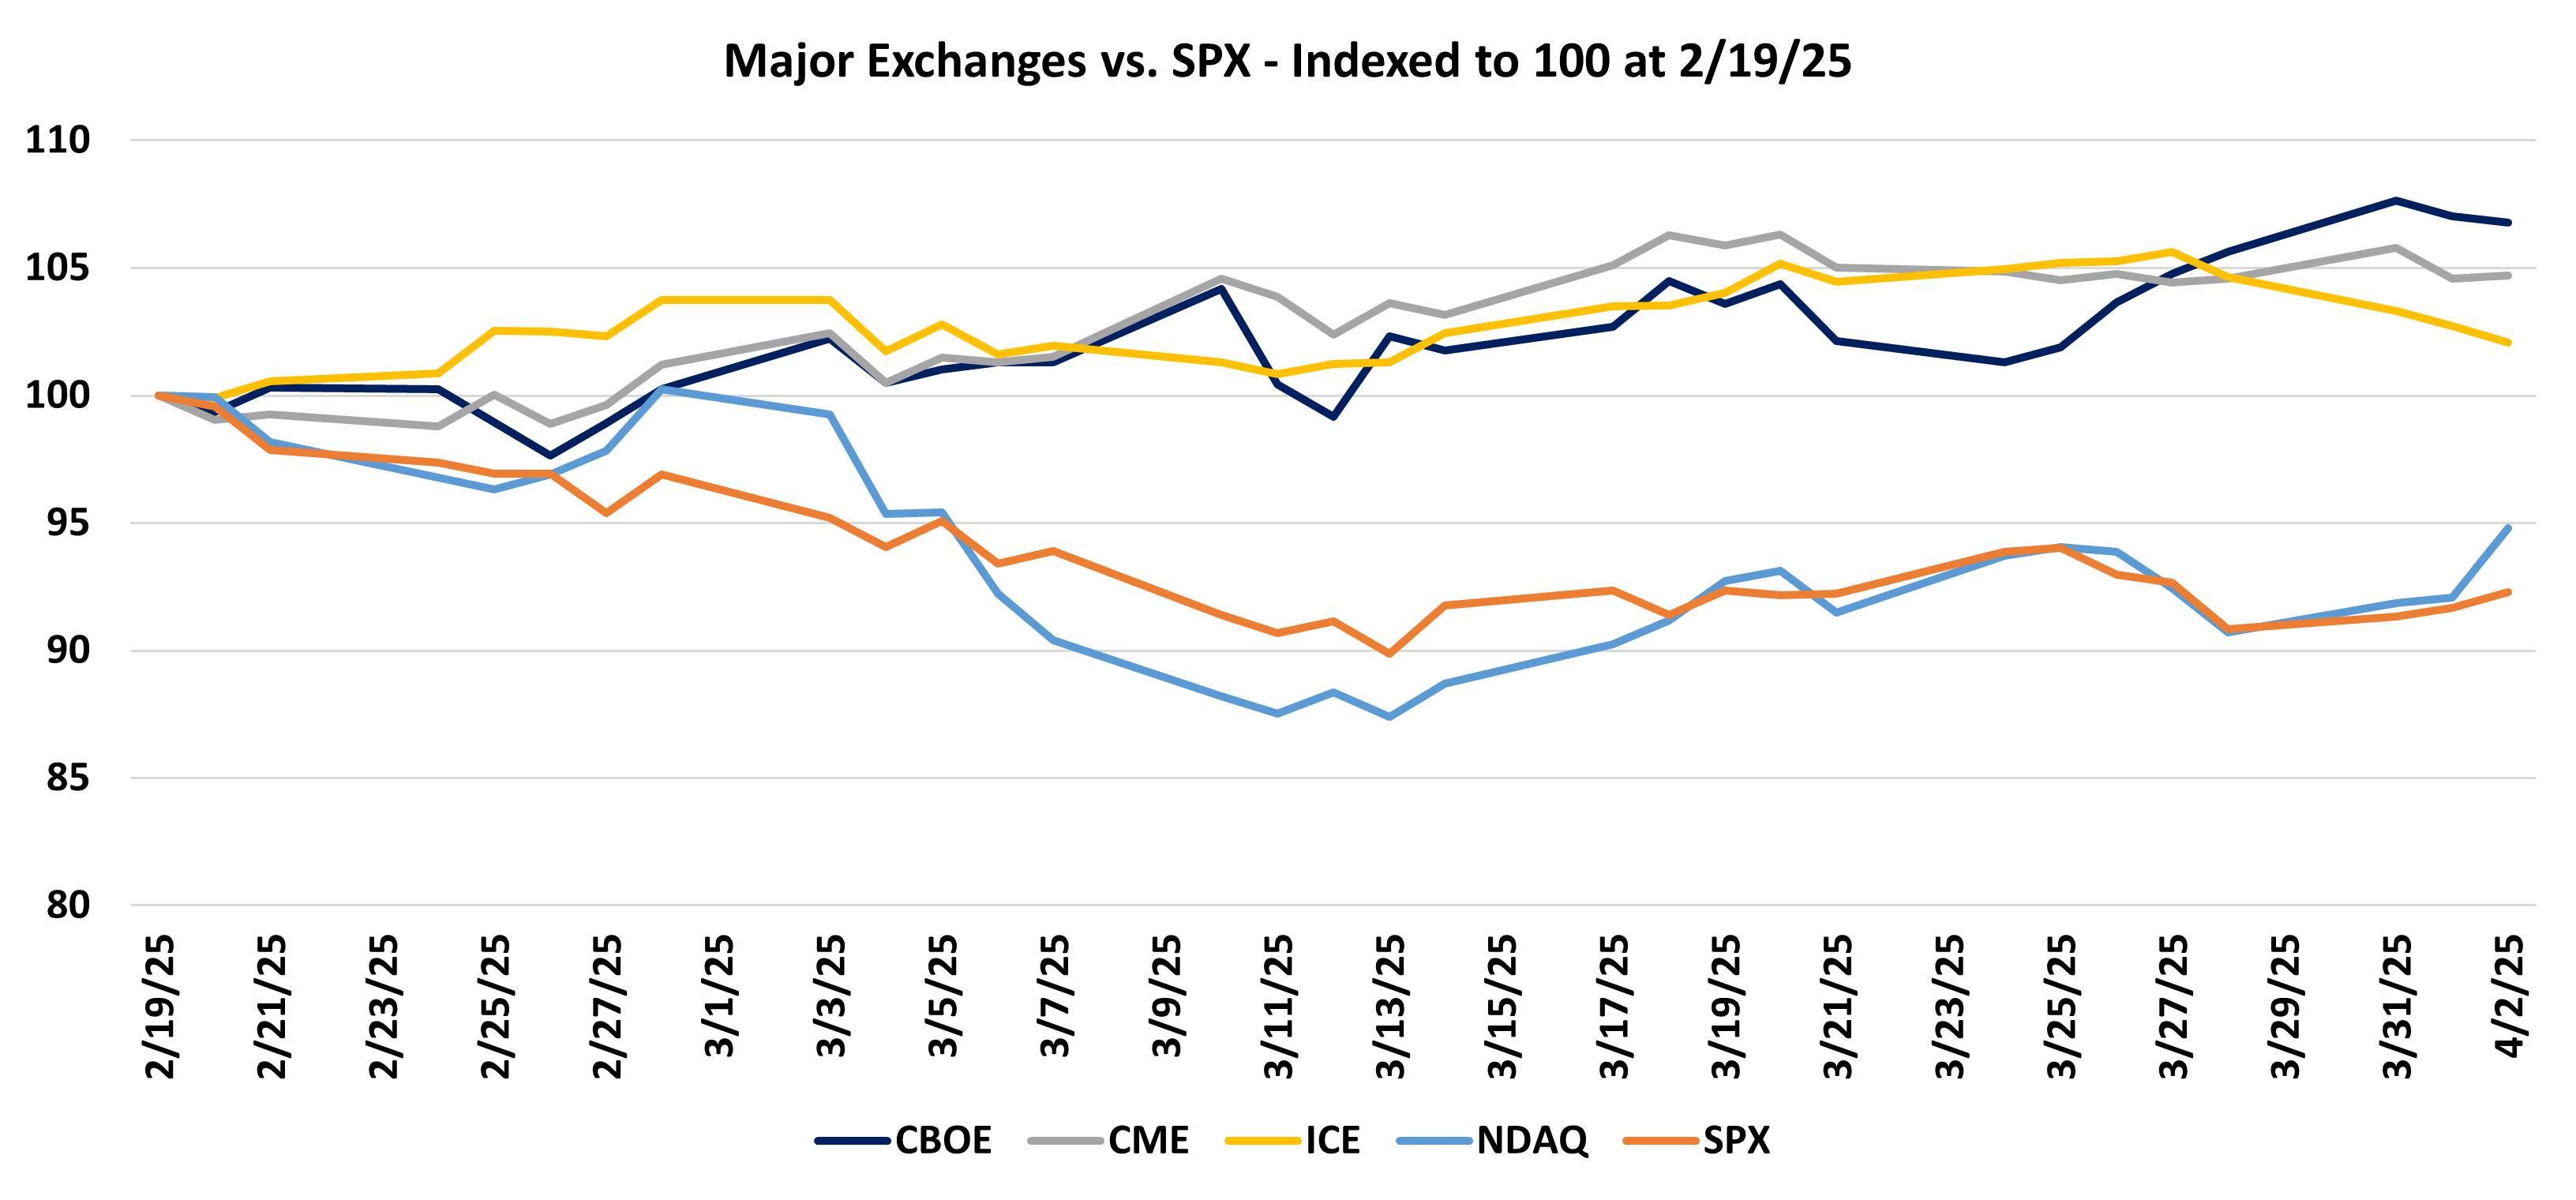
Exchange Stock Performance Since April 2

Source: Yahoo Finance
My hypothesis around the recent performance is two-fold. First, is that positioning was generally biased long the transaction focused exchanges leading into the reciprocal tariff announcement. From the market peak on February 19 through April 2, CBOE 0.00%↑ rose 7% and CME 0.00%↑ rose 5% while ICE 0.00%↑ was up 2%, NDAQ 0.00%↑ declined 5% and the S&P was down 8%. This could have led people to reduce positions following the tariff announcements and as trades unwound amidst a derisking as the market tanked, which may explain the more recent stock performance.
Exchange Stock Performance From February 19 - April 2
Source: Yahoo Finance
Second, and somewhat related to the above, would be that now that the tariff announcement has passed and the bought of volatility is making its way through the market, people believe that volatility and volumes will cool from these elevated levels. While I in no way believe that we will continue to see $1.6 trillion traded on U.S. equity exchanges for the long term, I do believe that the thought of a general easing of volatility and that this was a “one-off” type event is misguided. If the administration has shown us anything over the past 67 trading sessions, it’s that volatility is the new norm. The only certainty in today’s market is uncertainty and with that comes an increased need to trade and manage risk.
Given uncertainty seems to be the norm today, my expectation is that volumes and volatility remain elevated for the foreseeable future. If I simply assume 10% upside across all volumes for the exchanges, I see 9% upside to EPS estimates for CME, 8% upside for CBOE, 6% upside for ICE and 3% upside for NDAQ (note this analysis assumes no expense related offsets – higher comp due to higher revenues, etc.). Applying this EPS upside to consensus estimates for 2025, CBOE is trading at 20.6x NTM EPS, CME is at 21.4x, ICE is at 21.8x and NDAQ is at 22.0x. On this basis, CME appears to be trading at the cheapest valuation relative to its 3-year average multiple of 22.6x, followed by CBOE with a 3-year average multiple of 20.5x, then NDAQ with a 3-year average multiple of 21.7x and finally ICE with a 3-year average of 21.2x.
Consensus EPS Estimates, Upside from Volumes, and Valuations
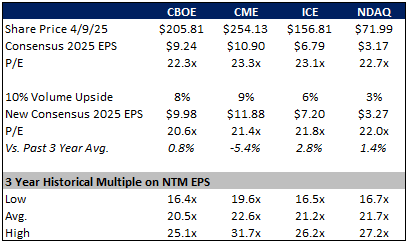
Source: Yahoo Finance
Given these dynamics, I would continue to own shares in CME and CBOE and potentially look to add to my positioning on these two stocks while remaining more cautious on shares of ICE and NDAQ.