Am I Crazy, Dumb (Missing Something) or Actually Stupid?
Commentary on HOOD Valuation plus A Recap of eBroker Monthly Metrics Reports for May

I Am Once Again Pounding the Table On The Craziness that is Robinhood’s Valuation
I wrote in a post on June 1 about how HOOD 0.00%↑’s valuation was mindboggling to me. In the time since, HOOD has continued its meteoric rise and is now trading at about 60x NTM EPS! (Note the chart below shows about 54x I’m not sure where the discrepancy is between what I see as NTM EPS $1.24 and the graphic below). Meanwhile, SCHW 0.00%↑ continues to trade at about 20x and IBKR 0.00%↑ has contracted a bit to 28x! I understand that some people have been playing this thing for potential S&P 500 inclusion, but at what point do you just say this is absurd, I’ve had enough?
HOOD, SCHW, IBKR Price to NTM EPS
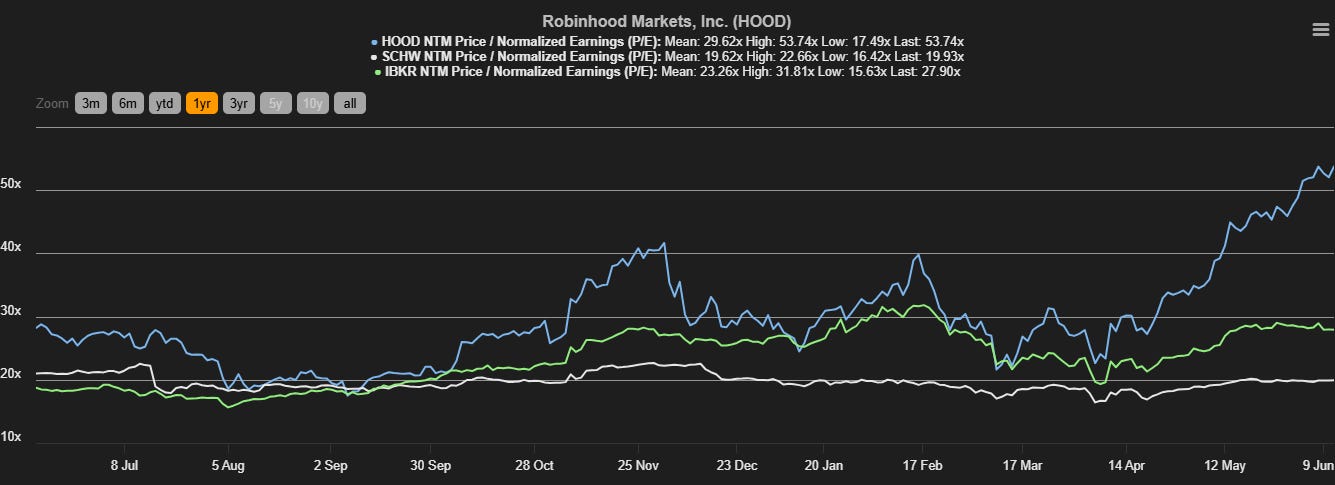
Source: TIKR.com
Before I continue, I would like to be clear, I see nothing inherently wrong with Robinhood. They have built a great business and the asset gathering trends certainly seem to reflect that fact as HOOD has averaged 34% annualized NNA growth over the past 12 months. What I do have a problem with is the extreme valuation mismatch amongst the eBrokers. Even comparing HOOD to ETOR 0.00%↑, which should also benefit from 1) a crypto-friendly environment and 2) the strong asset and client account growth it has managed to put up, the valuation mismatch is insane with ETOR trading at 26x NTM EPS.
eBroker Valuations
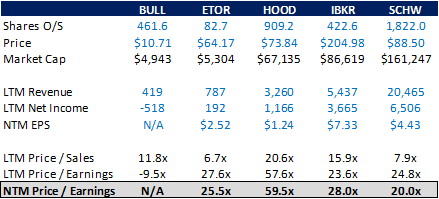
Source: Seeking Alpha
I absolutely admit that HOOD’s NNA growth is superior to that of SCHW, but what are we playing for here? If I assume that EPS for HOOD and SCHW grow inline with street estimates at 15% for the next two years (actually, SCHW EPS est. for 2025 is 30% growth while HOOD EPS est. for 2025 is 15% decline, but we’ll just say 15% for both for the heck of it) and thereafter EPS for each grows just at the same rate as NNA growth (6% for SCHW – midpoint of its range; 25% for HOOD – average over the past 4 years) it would take 8.5 years for the multiples of the two to converge, assuming no change in share price! Are we really going to front load 8.5 years of growth? Note: if I were to take year 1 to minus 15% growth for HOOD and plus 30% for SCHW, as consensus is actually expecting, this becomes about 11.5 years.
SCHW vs. HOOD Multiples and Growth
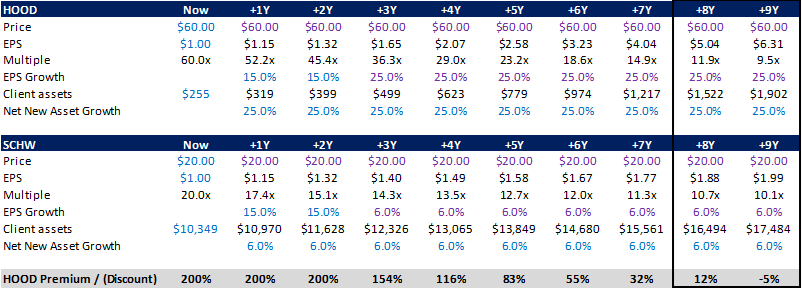
Source: Seeking Alpha, company documents and my estimates
Further, as you can see from the chart above, client assets for HOOD would surpass $1T by this point (another note, I am not assuming any market related gains/losses here). I find it exceedingly difficult to believe that HOOD will continue to generate NNA growth of 25% with an asset base over $1T. So at some point, this growth rate has to slow. For some context, TD Ameritrade had client assets of $1.3T when SCHW announced it was purchasing TD Ameritrade at the end of 2019. By this point, TD Ameritrade was generating NNA growth of 7-10%.
SCHW and TD Ameritrade Client Assets

Source: SCHW / TD Ameritrade merger slide deck
TD Ameritrade Client NNA and Annualized Growth Rate

Source: TD Ameritrade F4Q19 Earnings Release
And by the way, HOOD NNA growth rate slowed to 18% in May, the lowest level since October 2023, after it stopped promotional activity that had existed from January through April. I continue to scratch my head at this one and grow increasingly frustrated by the day. But if you do an X (Twitter) search for “$HOOD” about 100 results pop up every hour saying “$HOOD next stop $100!” So, maybe I’m just stupid…
Feel free to let me know in the comments.
With that, let’s dive into eBroker metrics for May:
Note: All valuation commentary as of close on June 12, 2025
Online Broker Metrics – May in Review
IBKR Monthly Metrics Release Link
HOOD Monthly Metrics Release Link
SCHW Monthly Metrics Release Link
Total Client Assets at Month End:
HOOD – Total Platform Assets $255.3B
IBKR – Total Client Equity $628.2B
SCHW – Total Client Assets $10,348.8B
HOOD – Year over Year growth 89.1% (59% adj. for $41B of TradePMR acquired assets)
IBKR – Year over Year growth 29.2%
SCHW – Year over Year growth 12.4%
Year over Year growth across the board increased M/M as May results benefitted from the market rebound during the month.
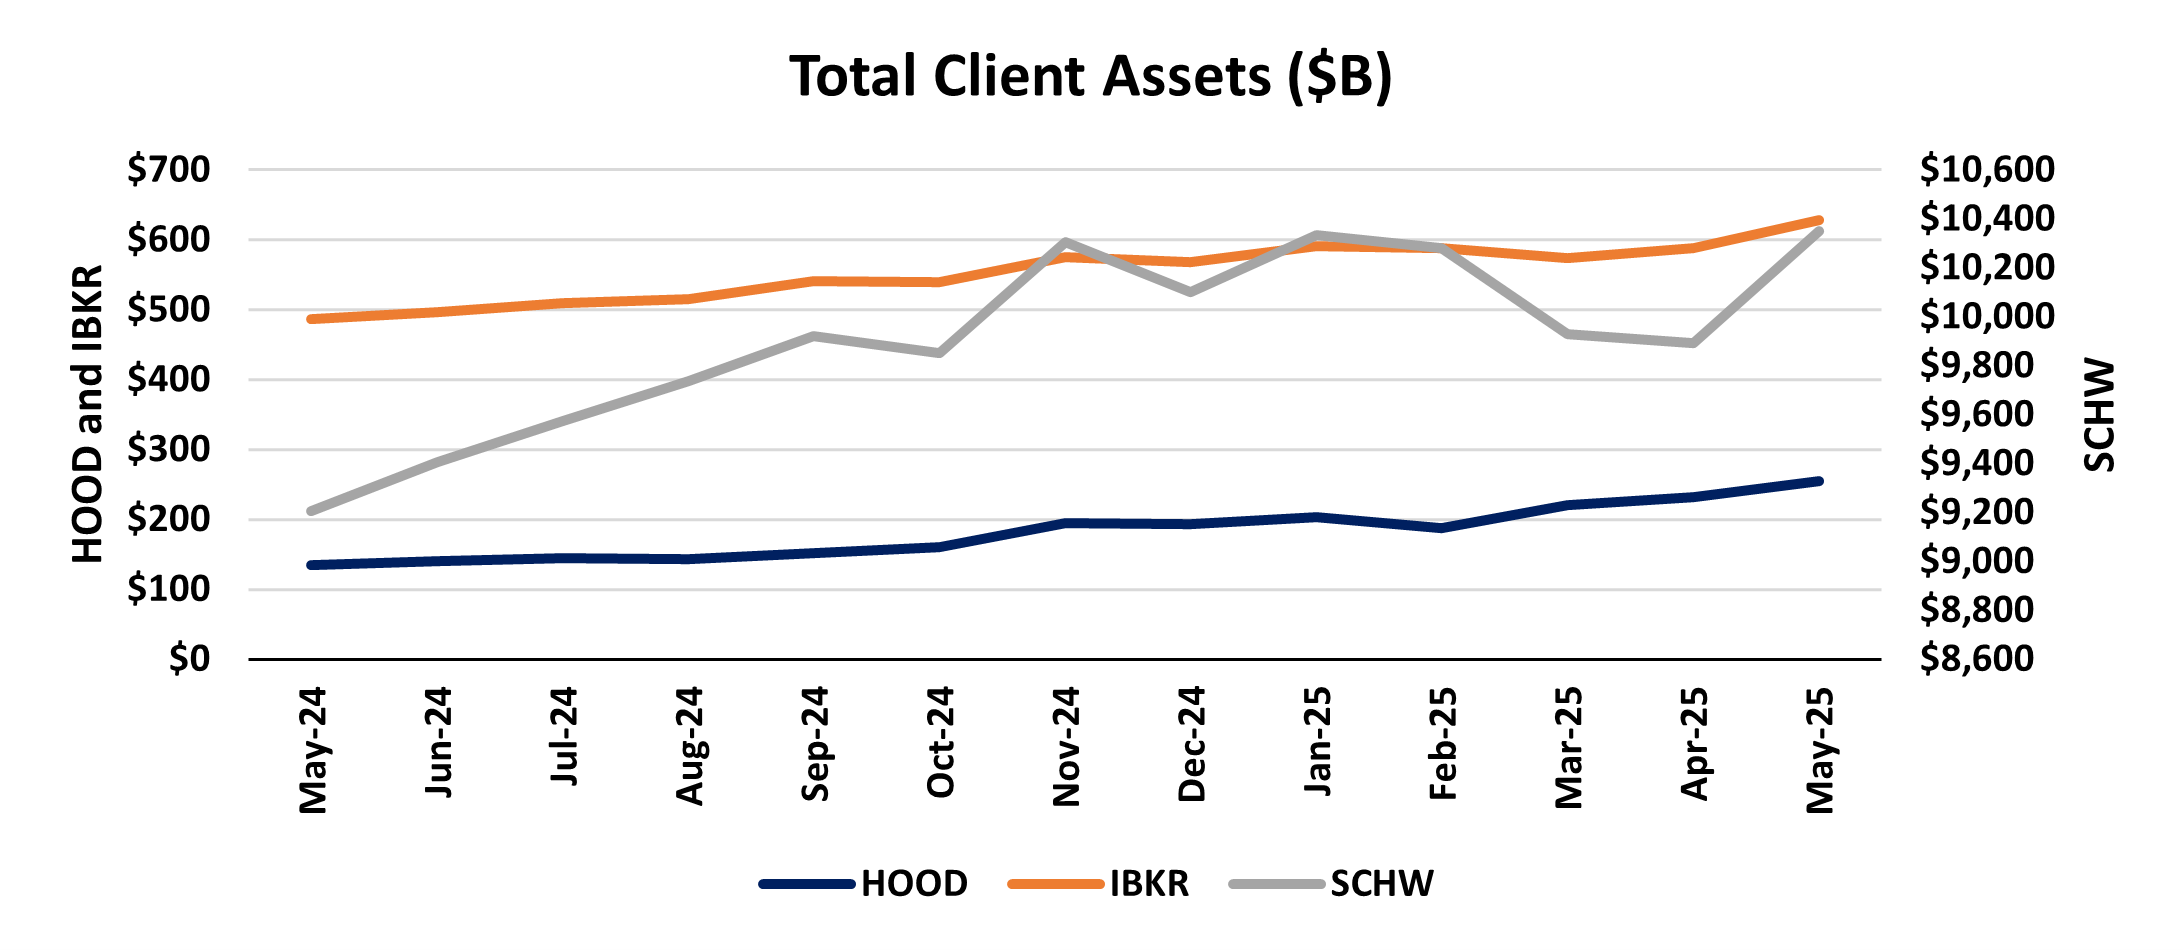
Source: company documents
Below I show the same chart, however, instead of putting SCHW on a different axis than IBKR and HOOD I have all on the left axis, just to show the sheer magnitude of SCHW’s total asset base…
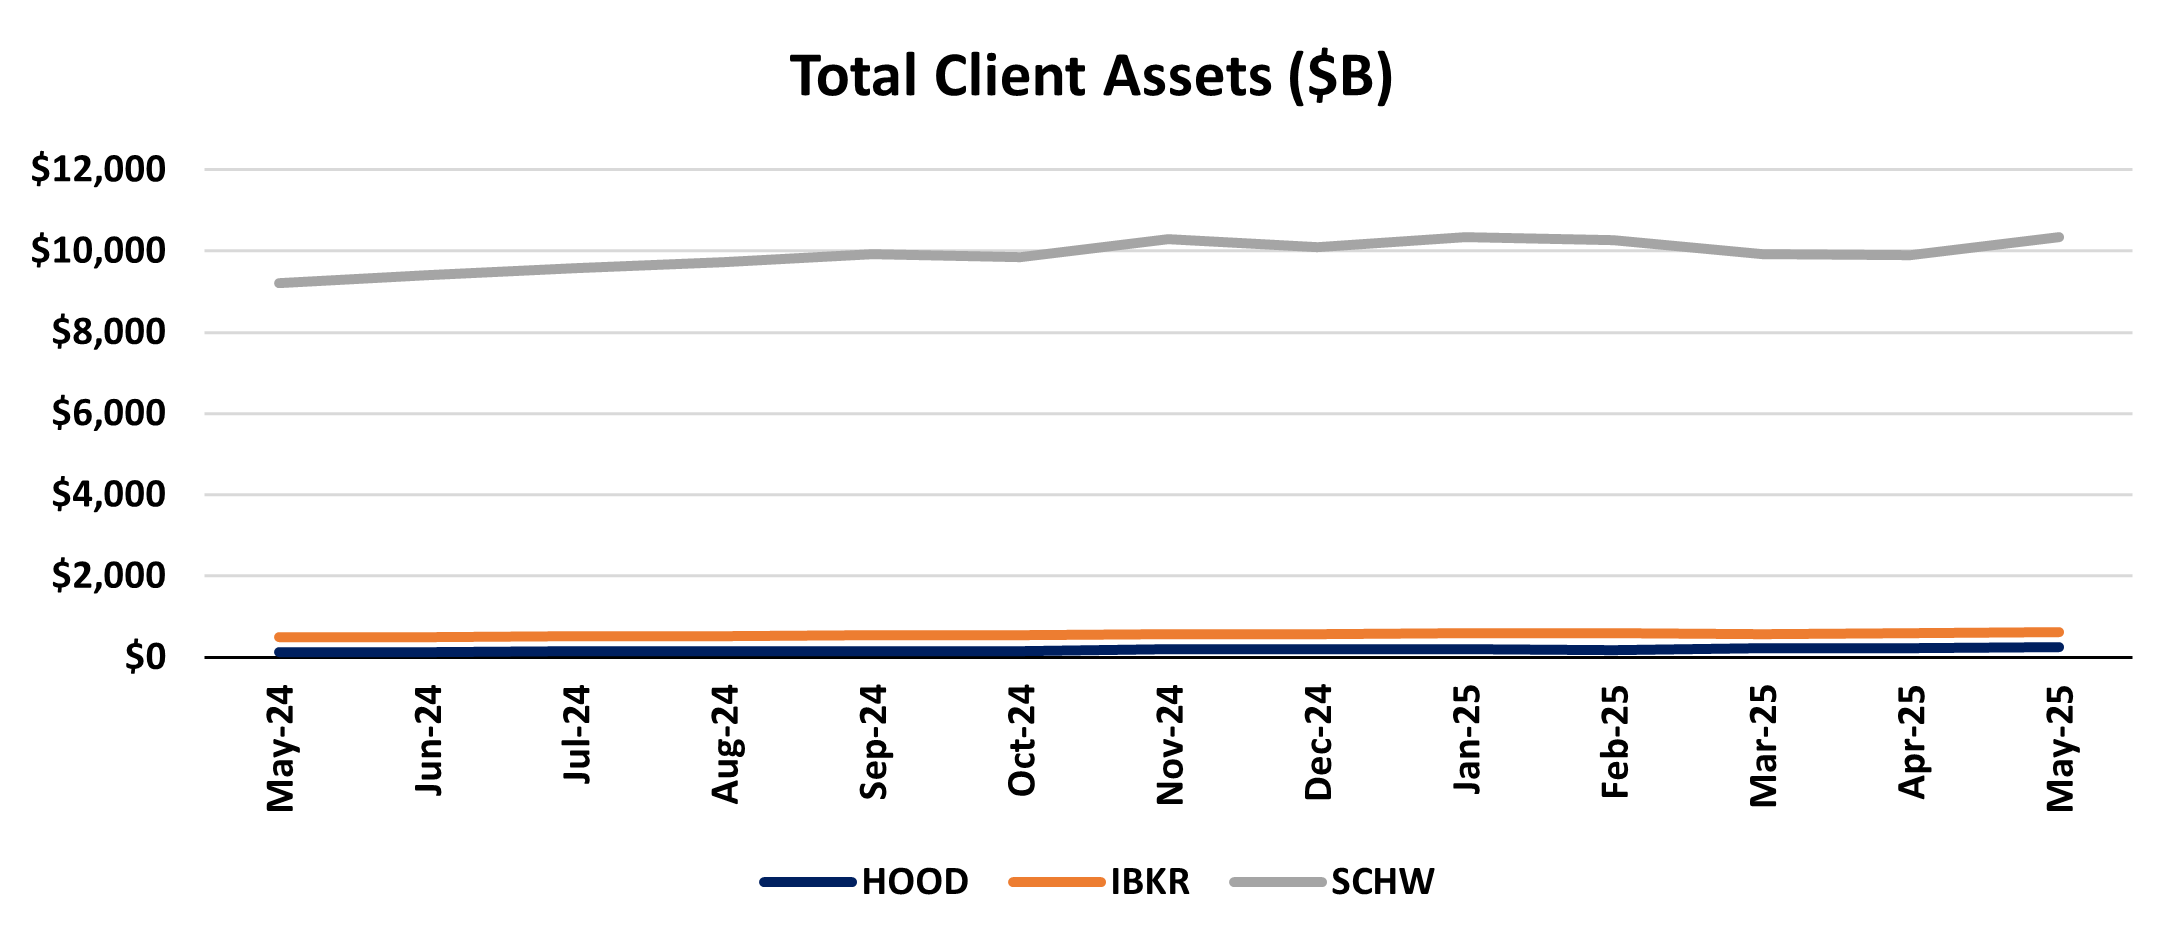
Source: company documents
Net New Assets:
HOOD – Total Net Deposits of $3.5B
IBKR – Total estimated Net New Assets of $16.6B*
SCHW – Total Core NNA of $35.0B
HOOD – NNA Annualized Growth Rate – 18.1%
IBKR – Estimated NNA Annualized Growth Rate – 33.8%*
SCHW – Core NNA Annualized Growth Rate – 4.2%
HOOD pace of asset gathering slowed dramatically in May as promotional activity from earlier in the year ran off. At 18% this was the slowest pace of NNA growth we’ve seen from HOOD since October 2023. That said, 18% continues to be an impressive figure and while it came in below the estimated annualized growth rate of IBKR this month it has fairly consistently exceeded the asset gathering pace of IBKR and remains miles above the asset gathering pace of SCHW. SCHW’s pace of NNA growth rebounded in May from the seasonally softer April level.
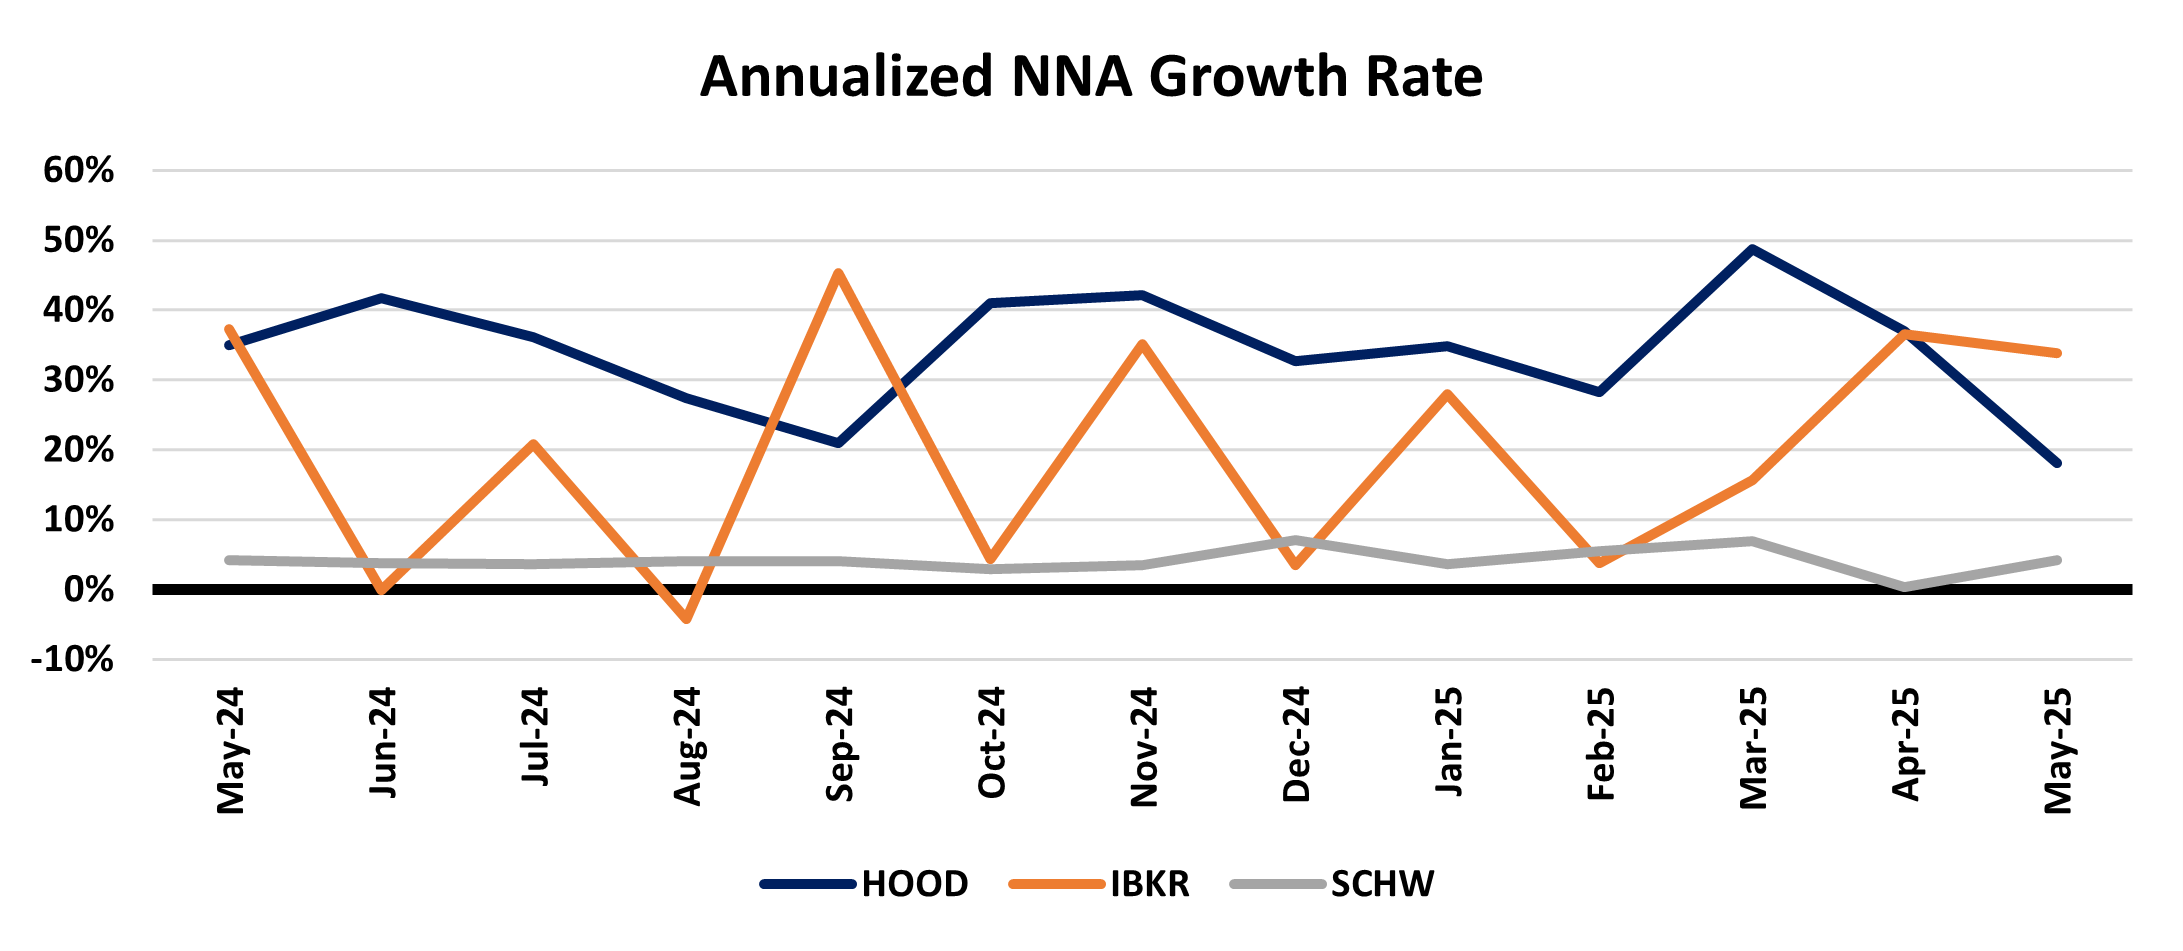
Source: company documents
* IBKR estimated NNA assumes market gains/losses in a given month reflect 65% of the M/M change in the S&P 500 and that any delta between those gains/losses and M/M asset growth/decline is due to NNA (which is probably not a perfect estimate – as can be seen by a couple months of negative NNA growth)
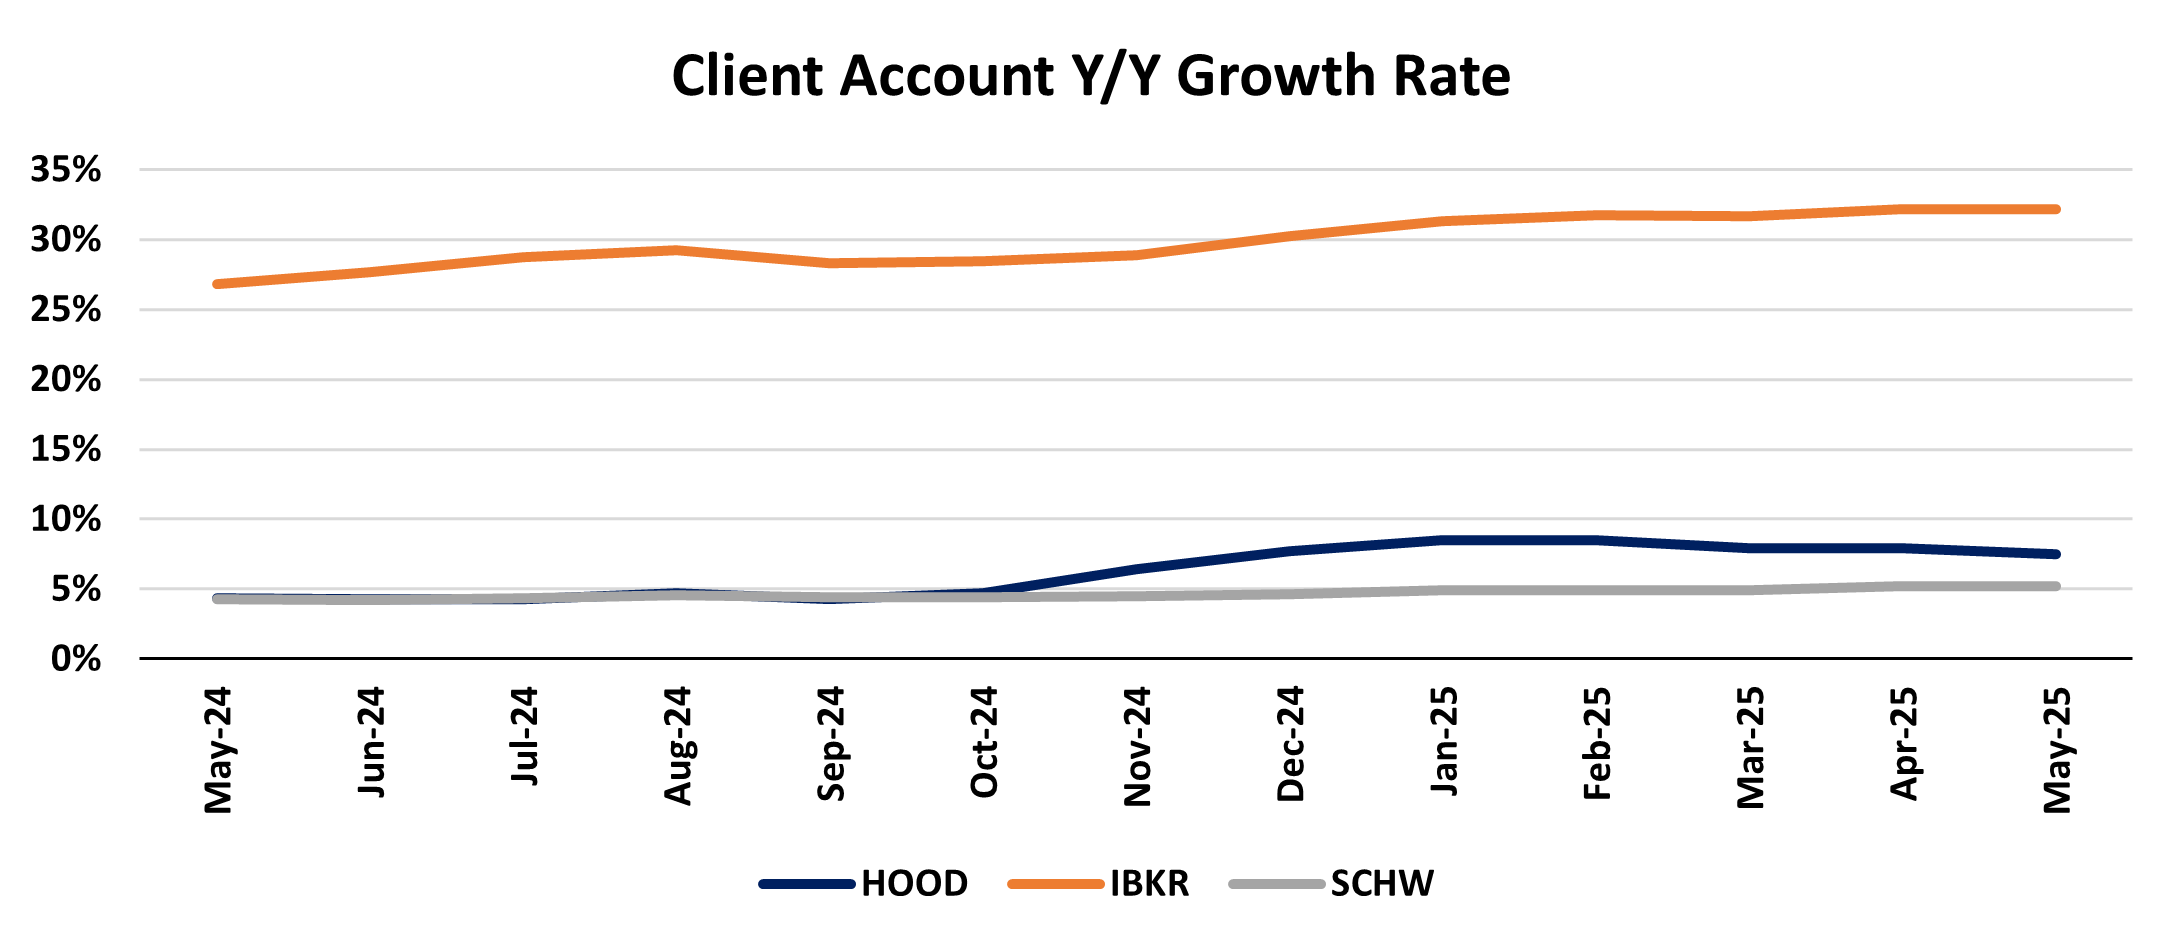
Total Client Accounts:
HOOD – Total Funded Customers of 25.9M
IBKR – Total Accounts of 3.8M
SCHW – Total Client Accounts (incl. banking and retirement plan) 45.0M
HOOD – Funded Customers Y/Y Growth – 7.5%
IBKR – Total Accounts Y/Y Growth – 32.2%
SCHW – Total Client Accounts Y/Y Growth – 5.2%
IBKR continues to bring in new accounts at breakneck pace, far above the account growth seen at HOOD or SCHW. HOOD client account growth began to break out the past couple quarters with the past 7 months of client account growth over 5%. For the most part, SCHW client accounts are growing roughly inline with its pace of NNA annualized growth (except April’s seasonally slower NNA month).

Source: company documents
Source: company documents
Two notable trends begin to take shape when comparing account growth metrics with annualized NNA growth metrics. First, given HOOD’s NNA growth is far outpacing its Y/Y growth in client accounts, this suggest to me that HOOD is beginning to target larger accounts and move up market as it targets becoming a more robust financial ecosystem. Second, given IBKR’s account growth has, for the most part, far outpaced its estimated NNA growth rate, this suggests to me that IBKR may be moving down market and attempting to bring in accounts with lower overall asset levels (essentially trying to take some of what HOOD has been successful at picking up). This trend can more clearly be seen below…
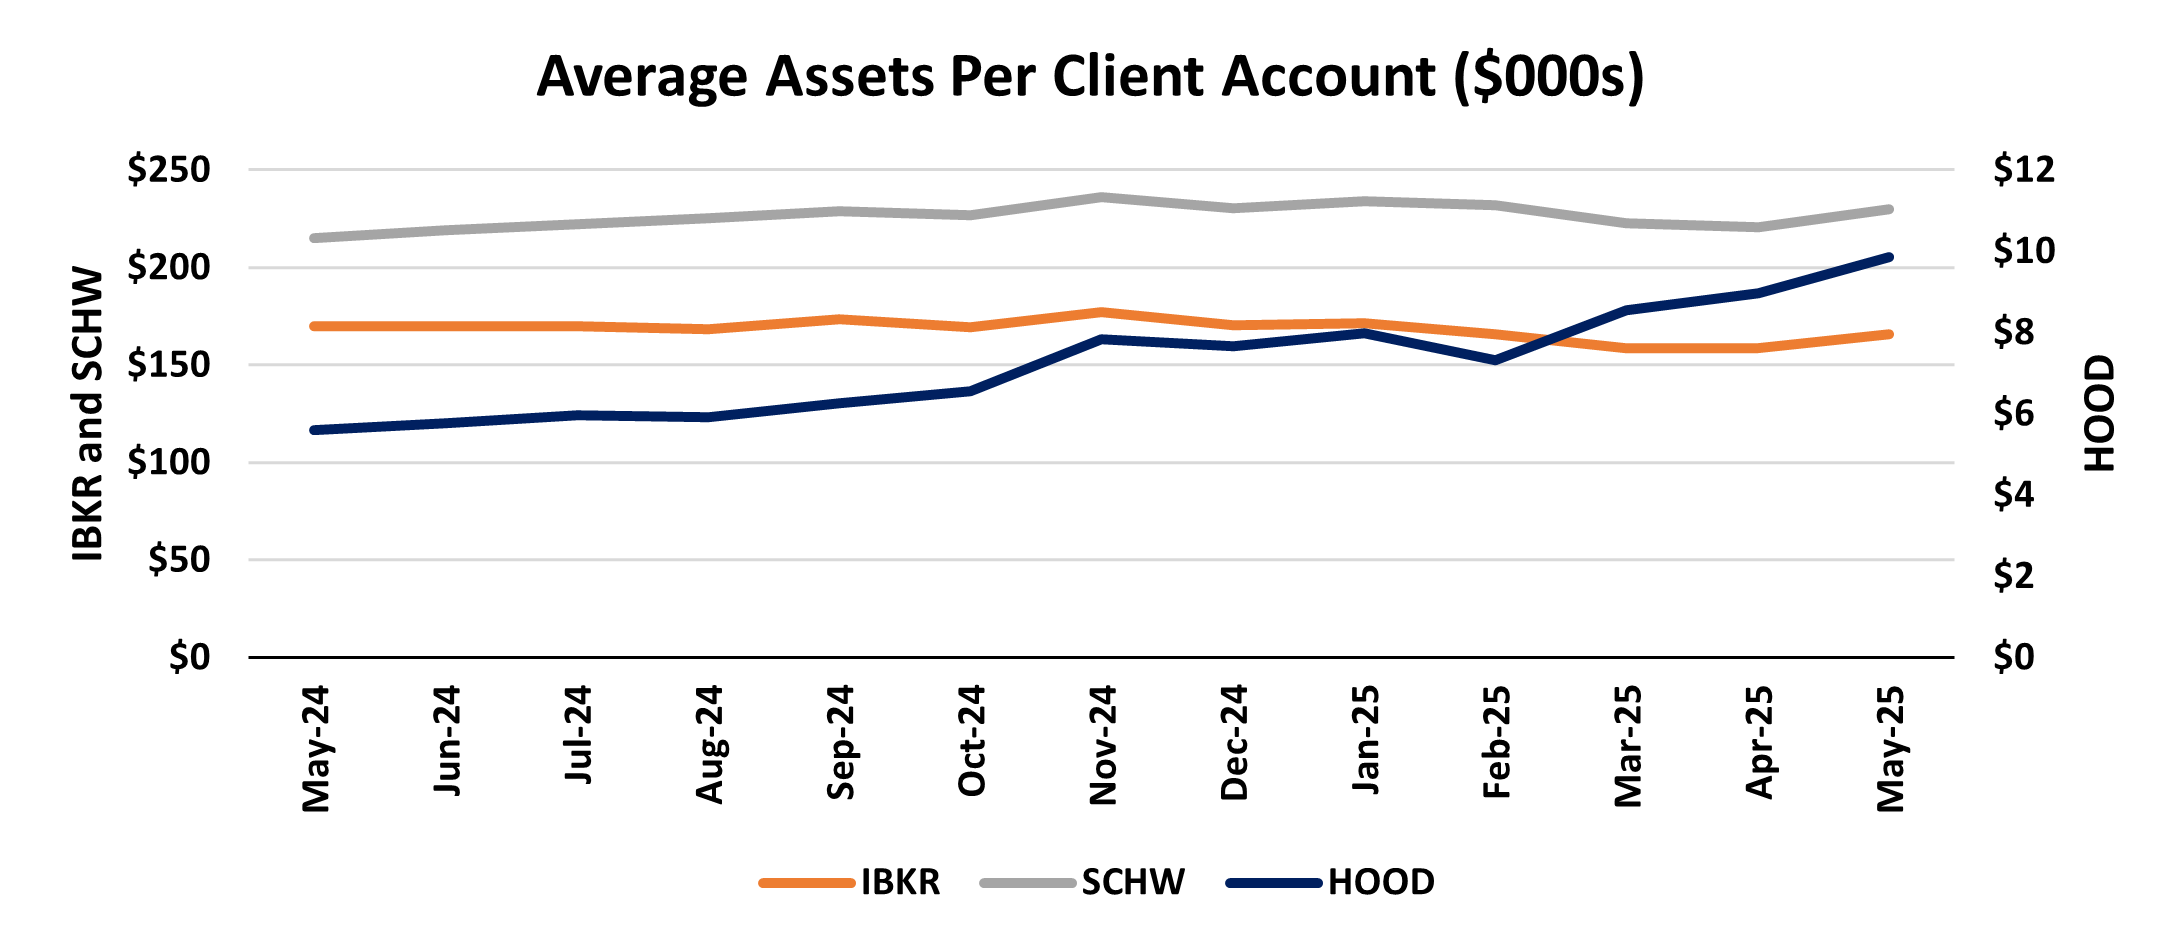
Average Assets Per Account:
HOOD – $9,857
IBKR – $165,940
SCHW – $229,897
HOOD – Y/Y Growth – 76.0%
IBKR – Y/Y Growth – (2.3%)
SCHW – Y/Y Growth – 6.8%
IBKR’s average assets per client account have begun to decline Y/Y (which should not be the case as markets have risen vs. a year ago, adding to average account value). Meanwhile, HOOD’s average account value has risen dramatically over the past few months. Notably, in its 1Q earnings call, HOOD mentioned that recent promotional activity had helped bring in new accounts with values of >$90k (and some >$180k).
Source: company documents
Similar to the beginning of this note, below I show the same chart, however, instead of putting HOOD on a different axis than IBKR and SCHW I have all on the left axis, just to show the stark difference in average account balances…
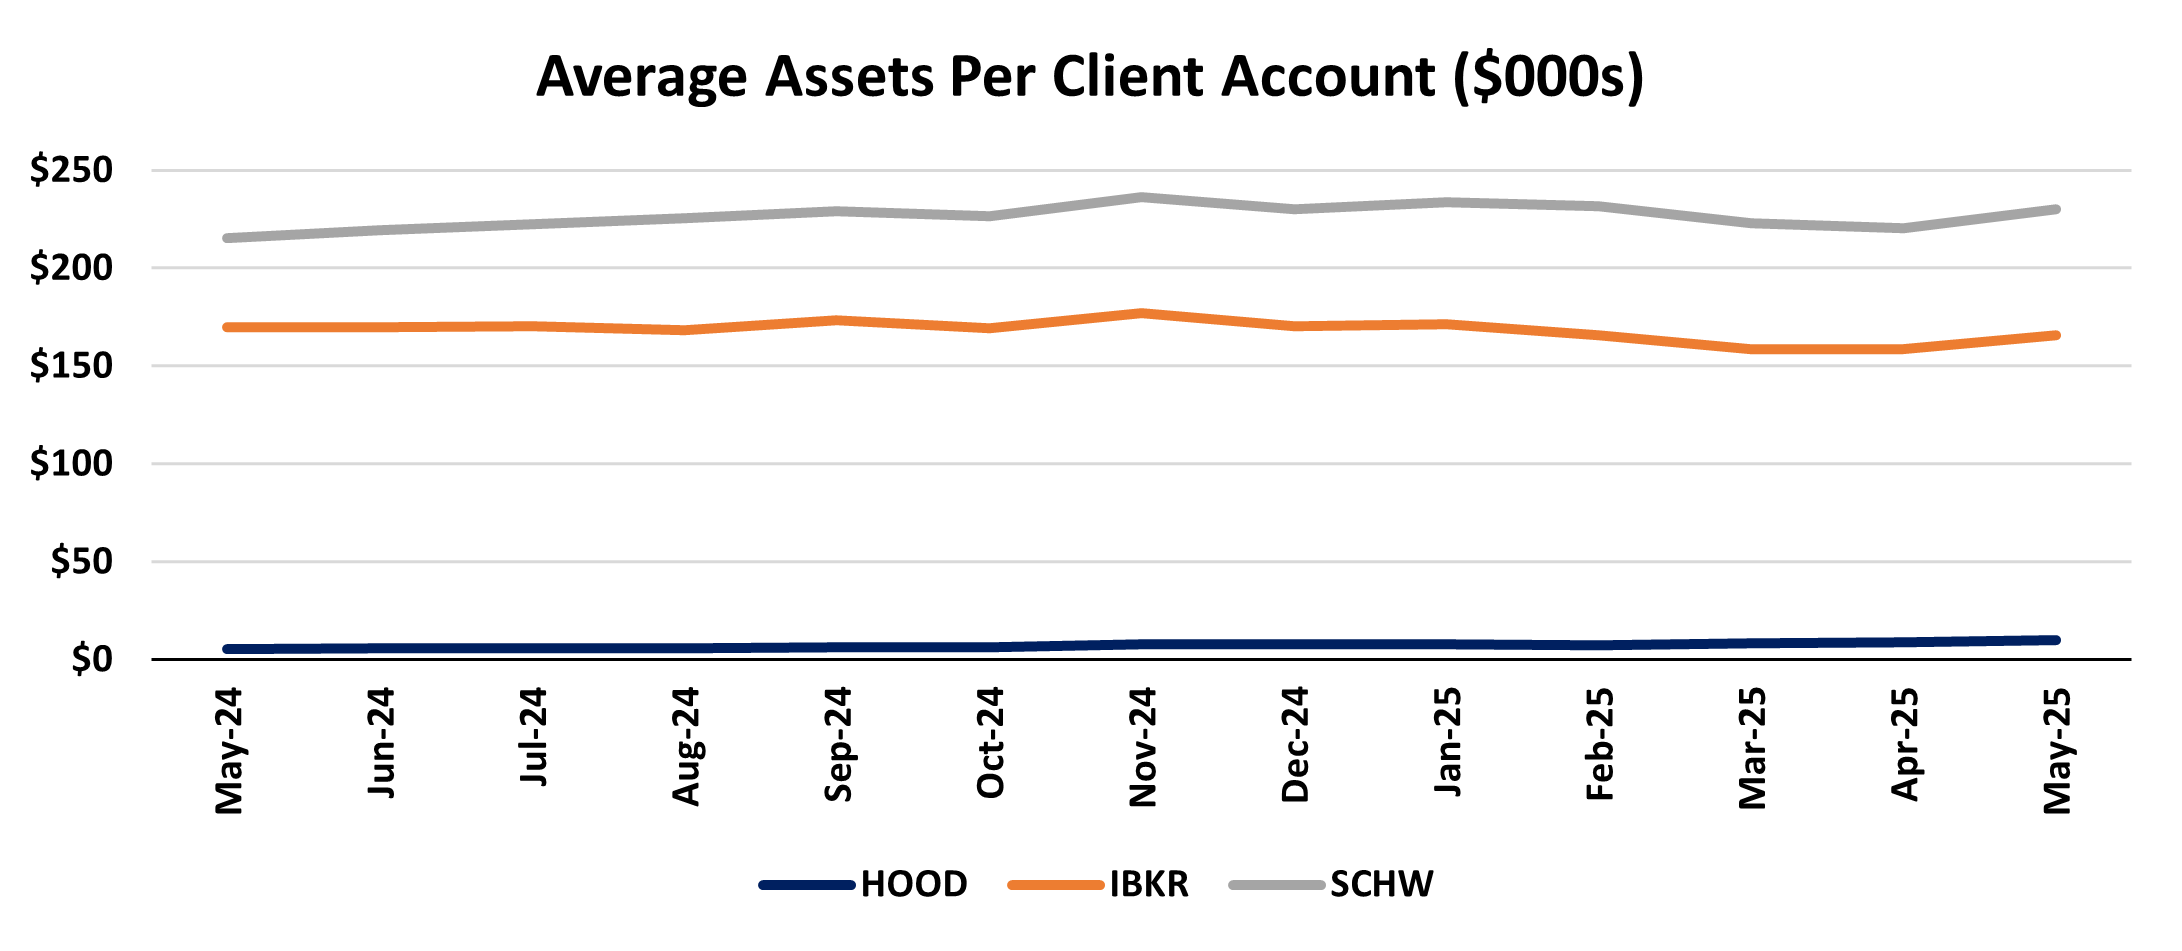
Source: company documents
Below is the Y/Y growth in average assets per account, showing HOOD clearly breaking out…

Source: company documents
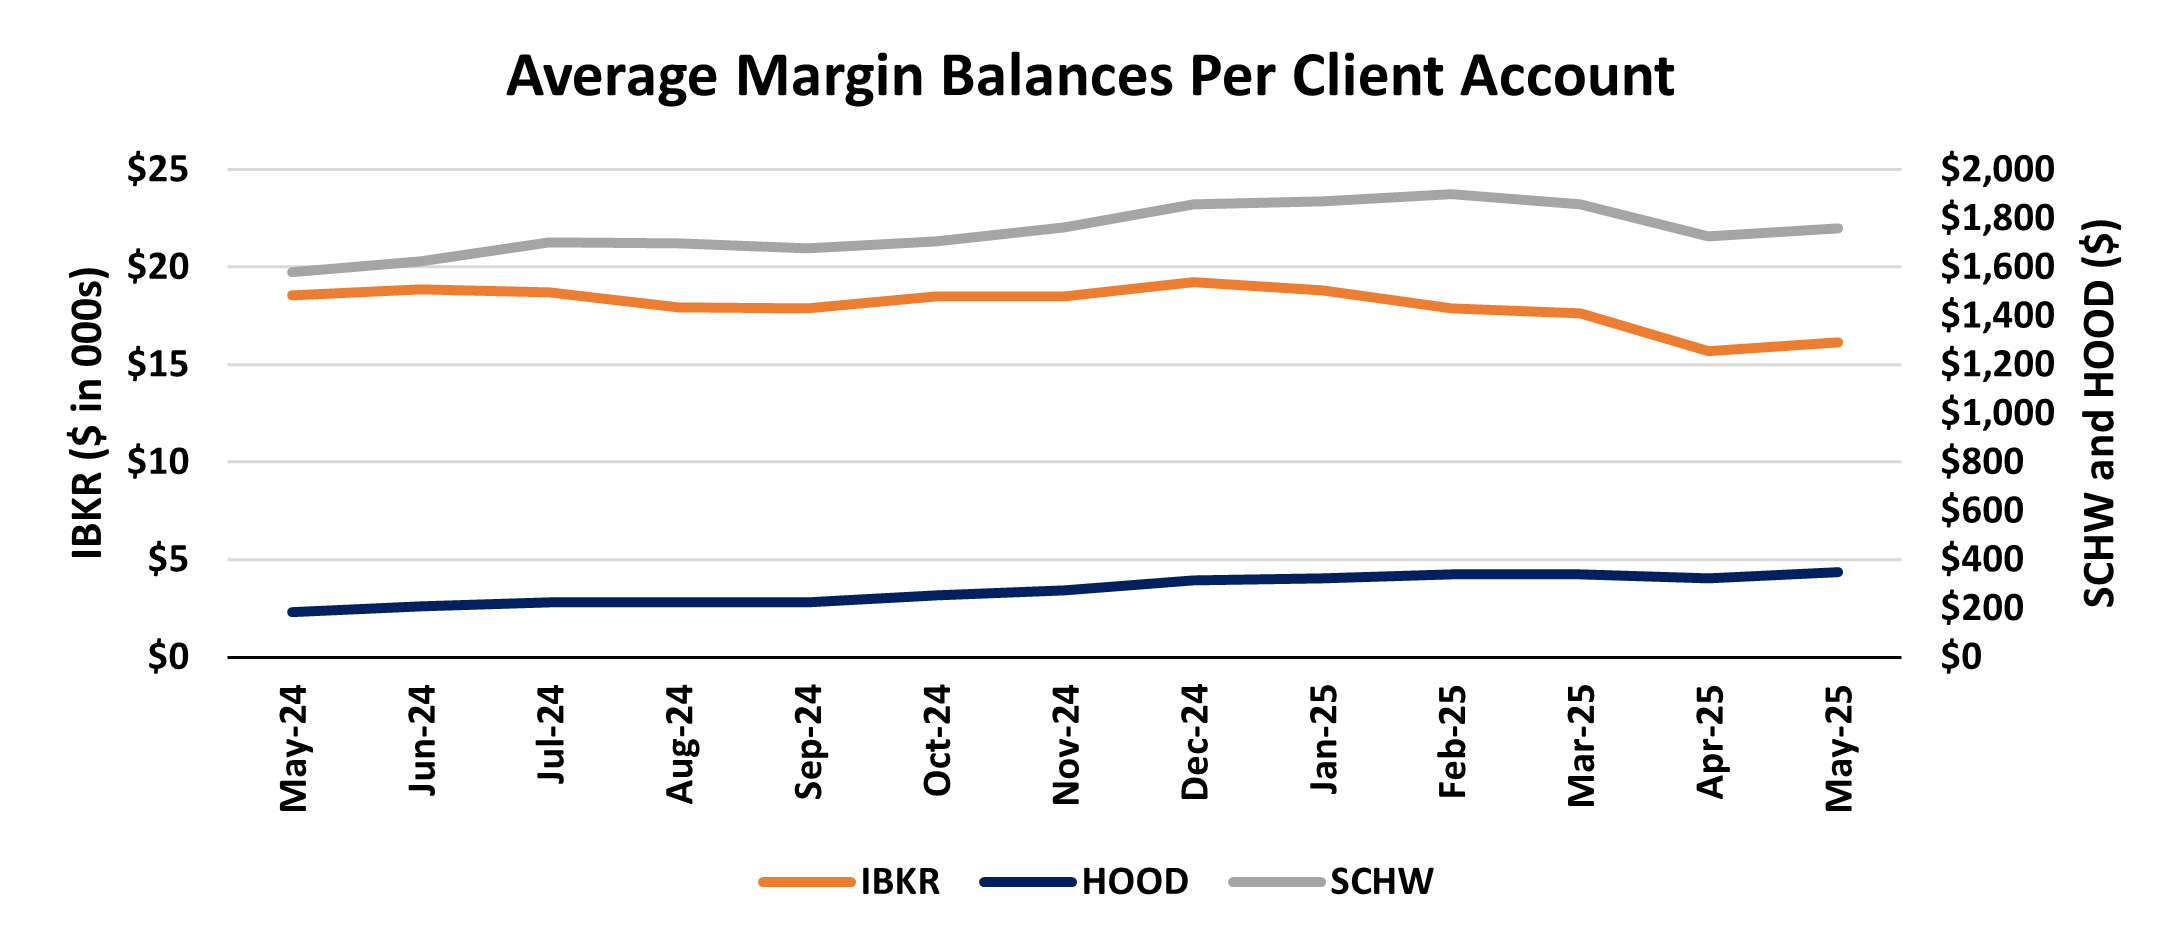
Margin Loans:
HOOD – $9.0B
IBKR – $61.2B
SCHW – $79.1B
HOOD – Avg. Margin Balances per Account $347
IBKR – Avg. Margin Balances per Account $16,166
SCHW – Avg. Margin Balances per Account $1,758
HOOD – Y/Y Growth Avg. Balances per Account – 86.1%
IBKR – Y/Y Growth Avg. Balances per Account – (12.8%)
SCHW – Y/Y Growth Avg. Balances per Account – 11.2%
Similar to average asset trends, IBKR’s average margin loans per client account have begun to decline Y/Y. Meanwhile, HOOD’s average margin balance has risen dramatically over the past few months.
Source: company documents
Below is the Y/Y growth in average assets per account, showing HOOD clearly breaking out…

Source: company documents
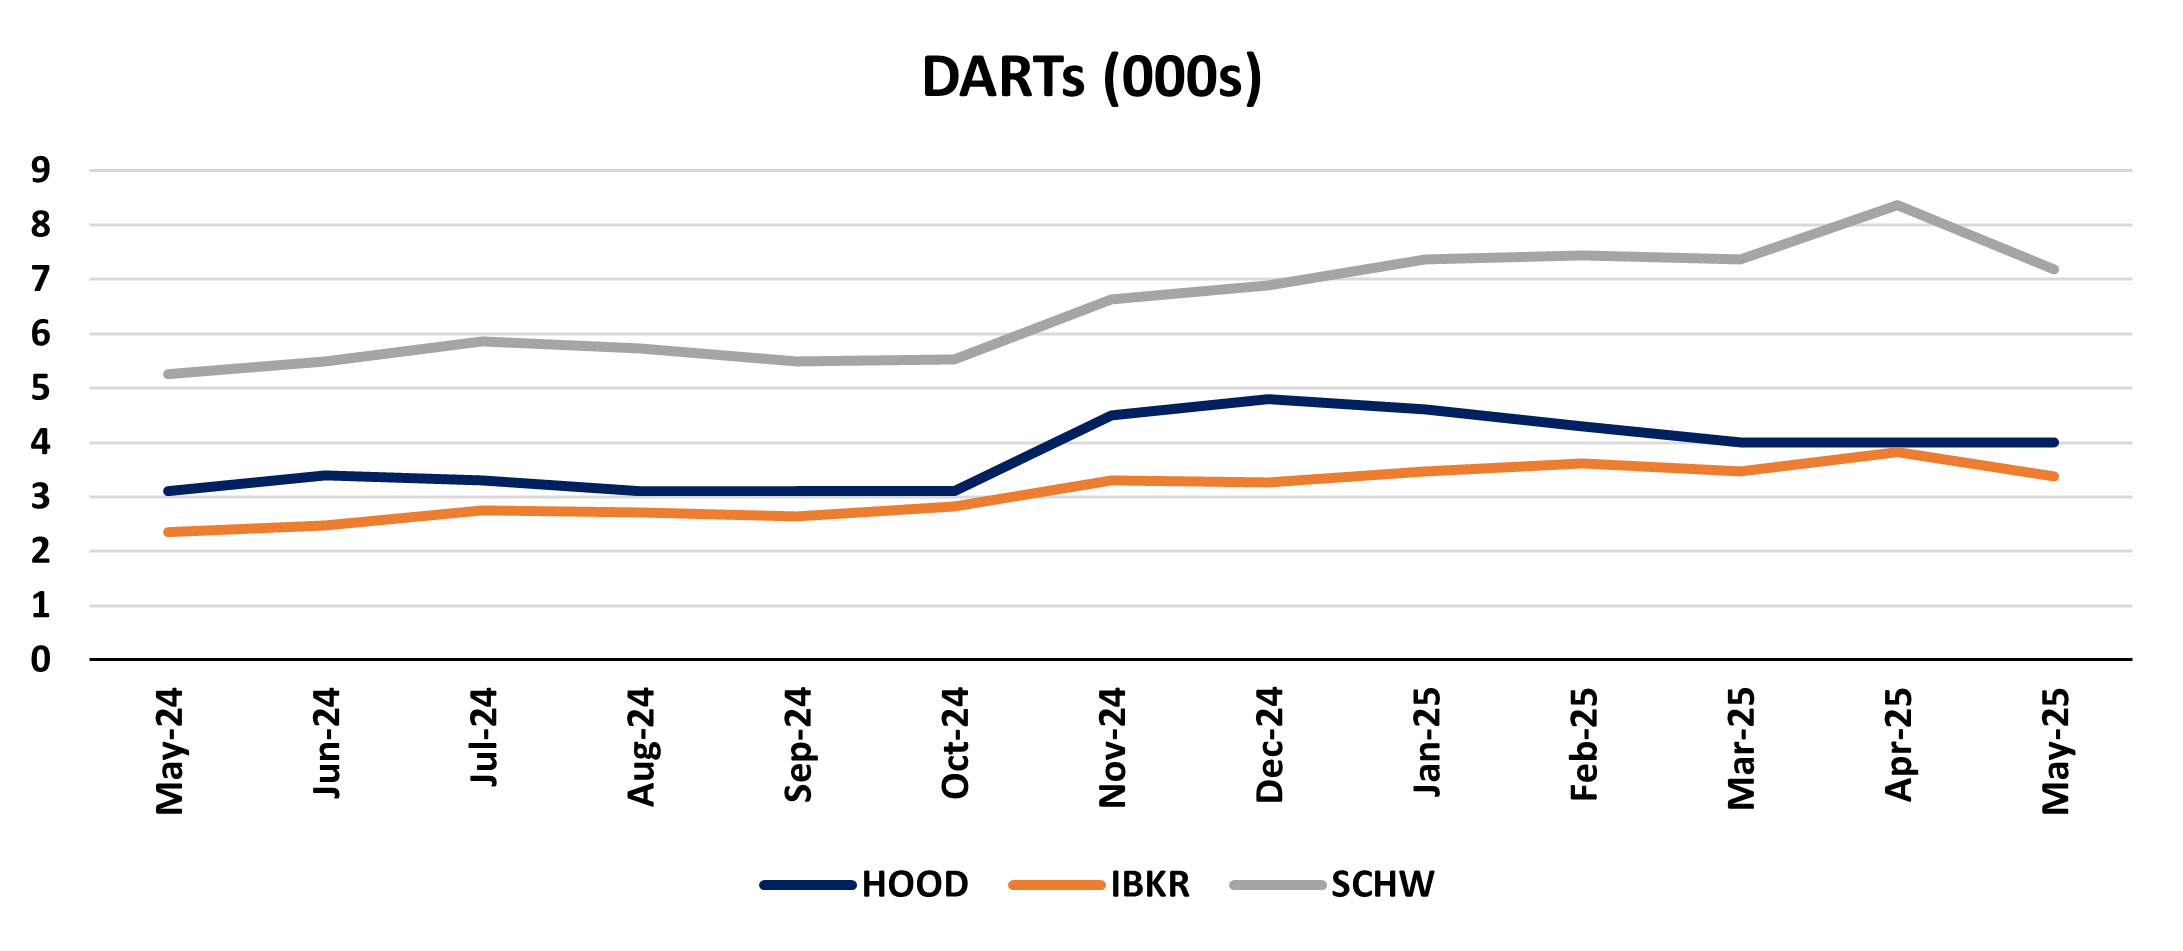
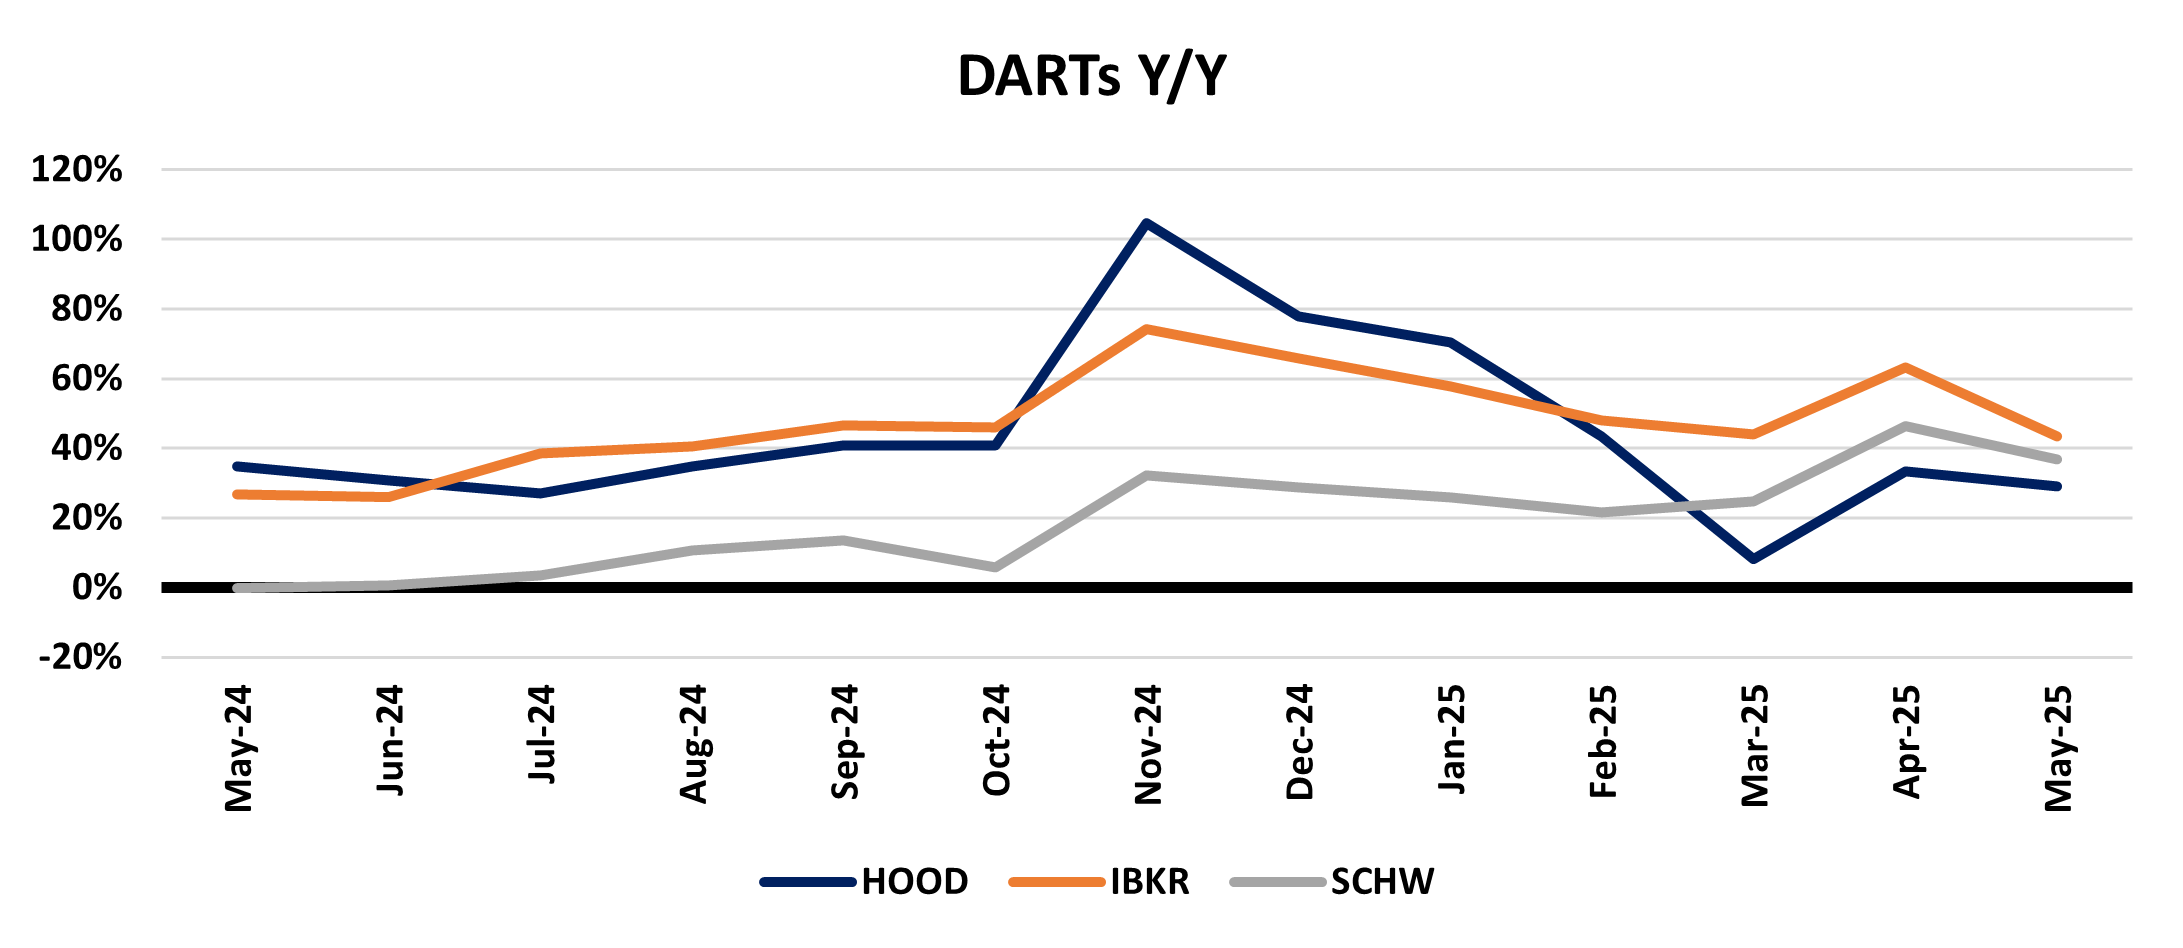
DARTs:
HOOD – 4,000k
IBKR – 3,384k
SCHW – 7,184k
HOOD – Y/Y Growth – 29%
IBKR – Y/Y Growth – 43%
SCHW – Y/Y Growth – 37%
Given continued volatility in the overall market, DARTs across the board remain up significantly Y/Y as clients have been taking advantage of the constantly changing backdrop to adjust positions.
Source: company documents
While DARTs remain up Y/Y, the pace of growth slowed a bit in May with volatility falling M/M.
Source: company documents
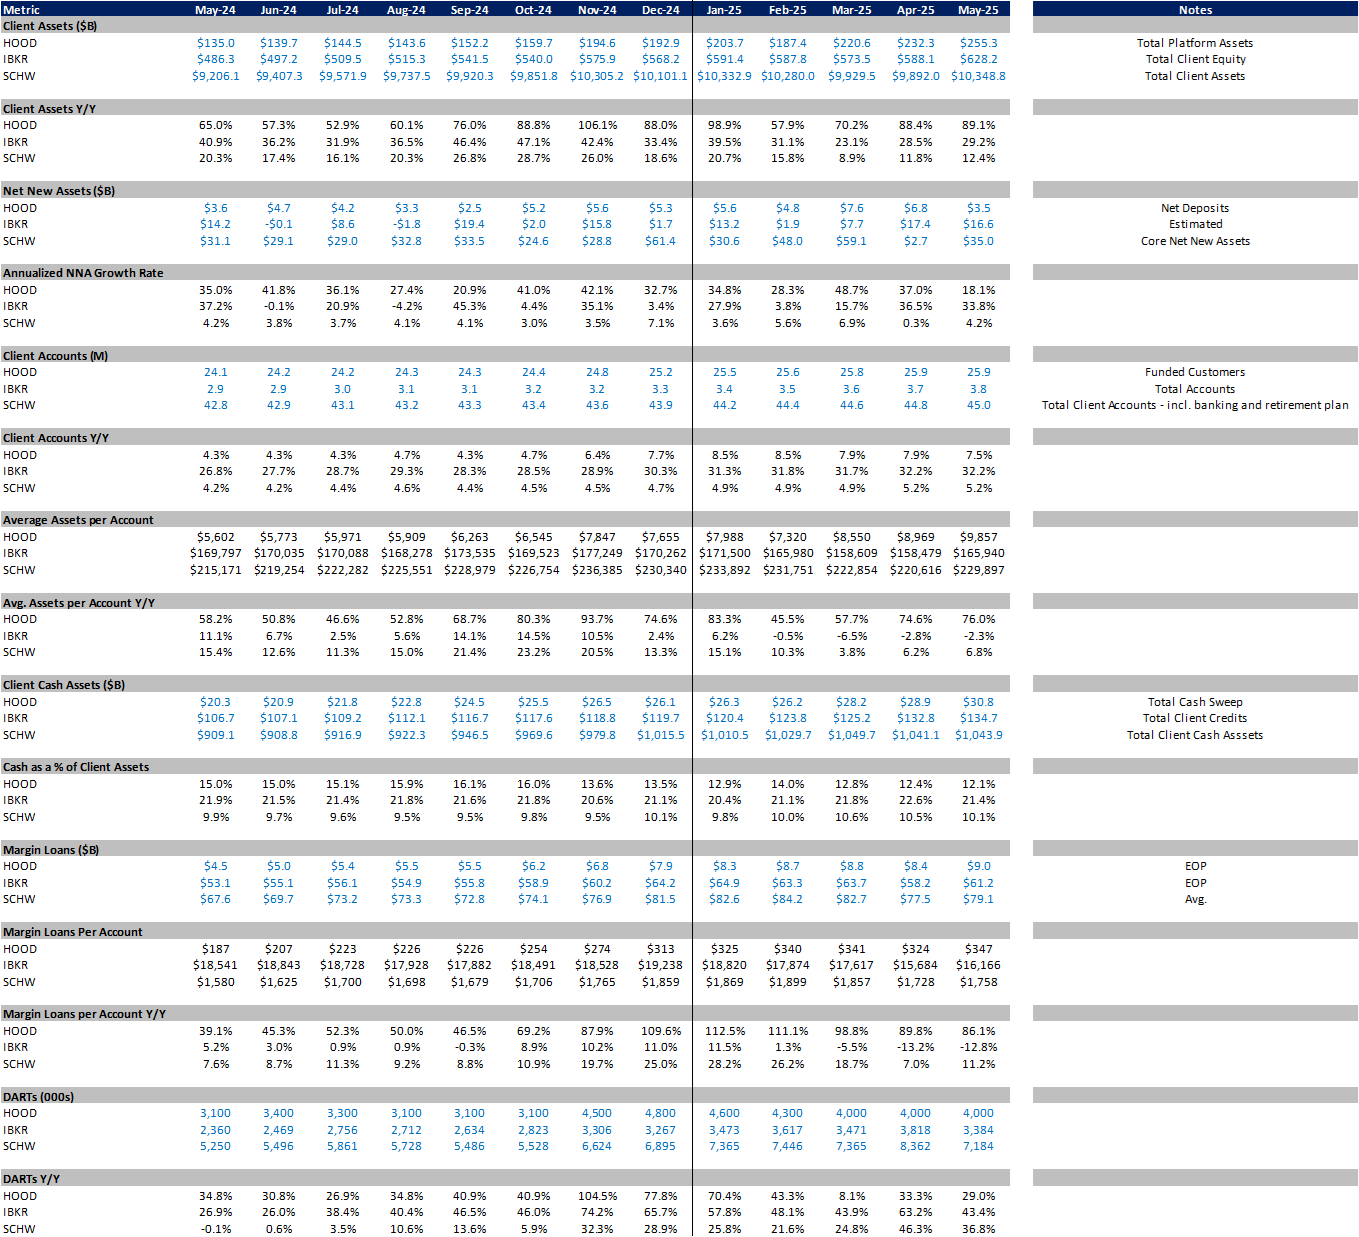
Consolidated Metrics:
Below is a complete table of all of the metrics discussed above as well as some detail on cash balance trends. I apologize for how much space this takes up: